AI Stocks Fall: The Spending-to-Profit Test
The 30 October 2026 tech sell-off explained: falling share prices, AI investment and the difference between demand and investor expectations.
Explore the five-scene explainerKey takeaways
- US technology shares fell sharply at the 30 October close.
- Daily stock returns measure repricing, not changes in company sales.
- Supplier demand and the investment payback question can point in different directions.
Sourced figures and status
| Period | Figure or status | Source |
|---|---|---|
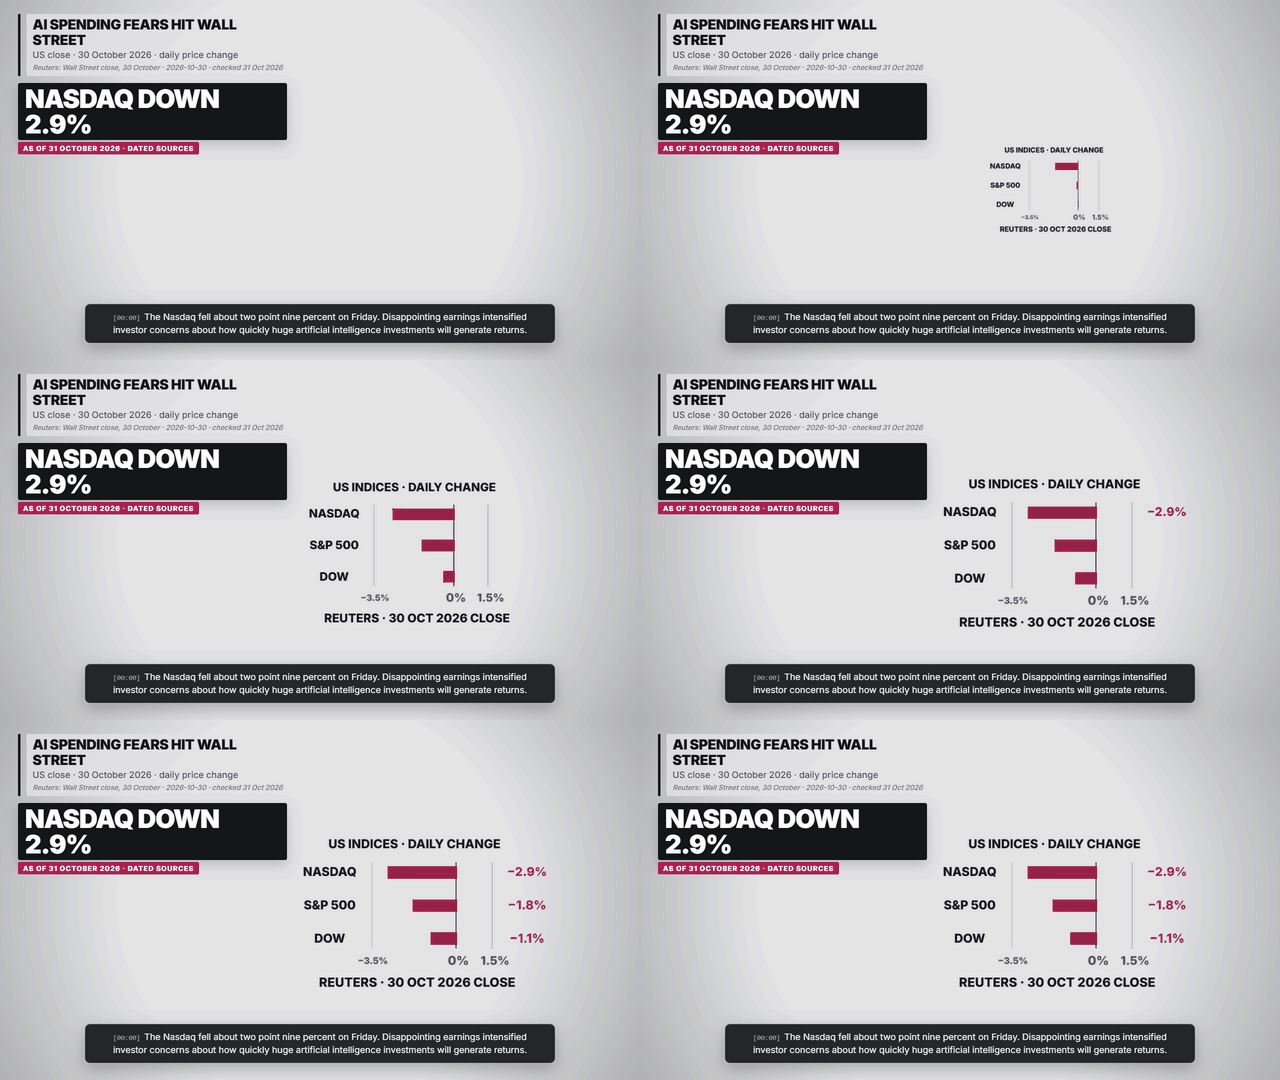
| 30 Oct 2026 US close | Nasdaq −2.86%; S&P 500 −1.82%; Dow −1.09%. | Reuters: Wall Street close, 30 October · 2026-10-30 |
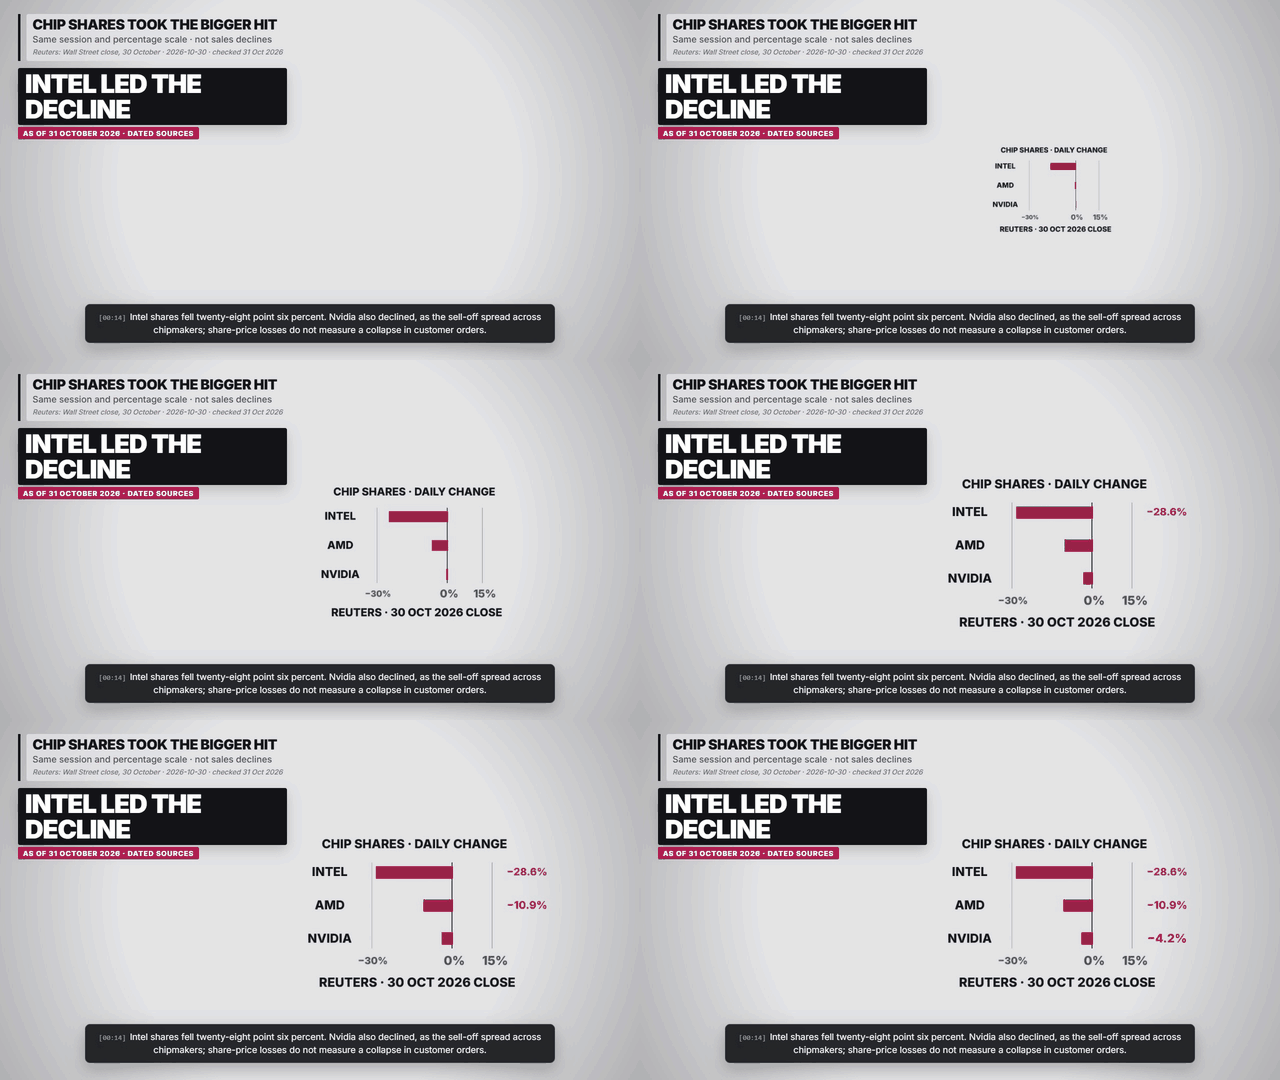
| 30 Oct 2026 US close | Intel −28.6%; AMD −10.9%; Nvidia −4.2%. | Reuters: Wall Street close, 30 October · 2026-10-30 |
Why did the sell-off matter?
Earnings disappointment put the timing of AI returns back at the centre of the market discussion. The reaction was strongest in parts of the semiconductor sector. A daily market move combines expectations, valuations and new information; it cannot isolate one cause. Source and qualifications.
How can demand remain strong?
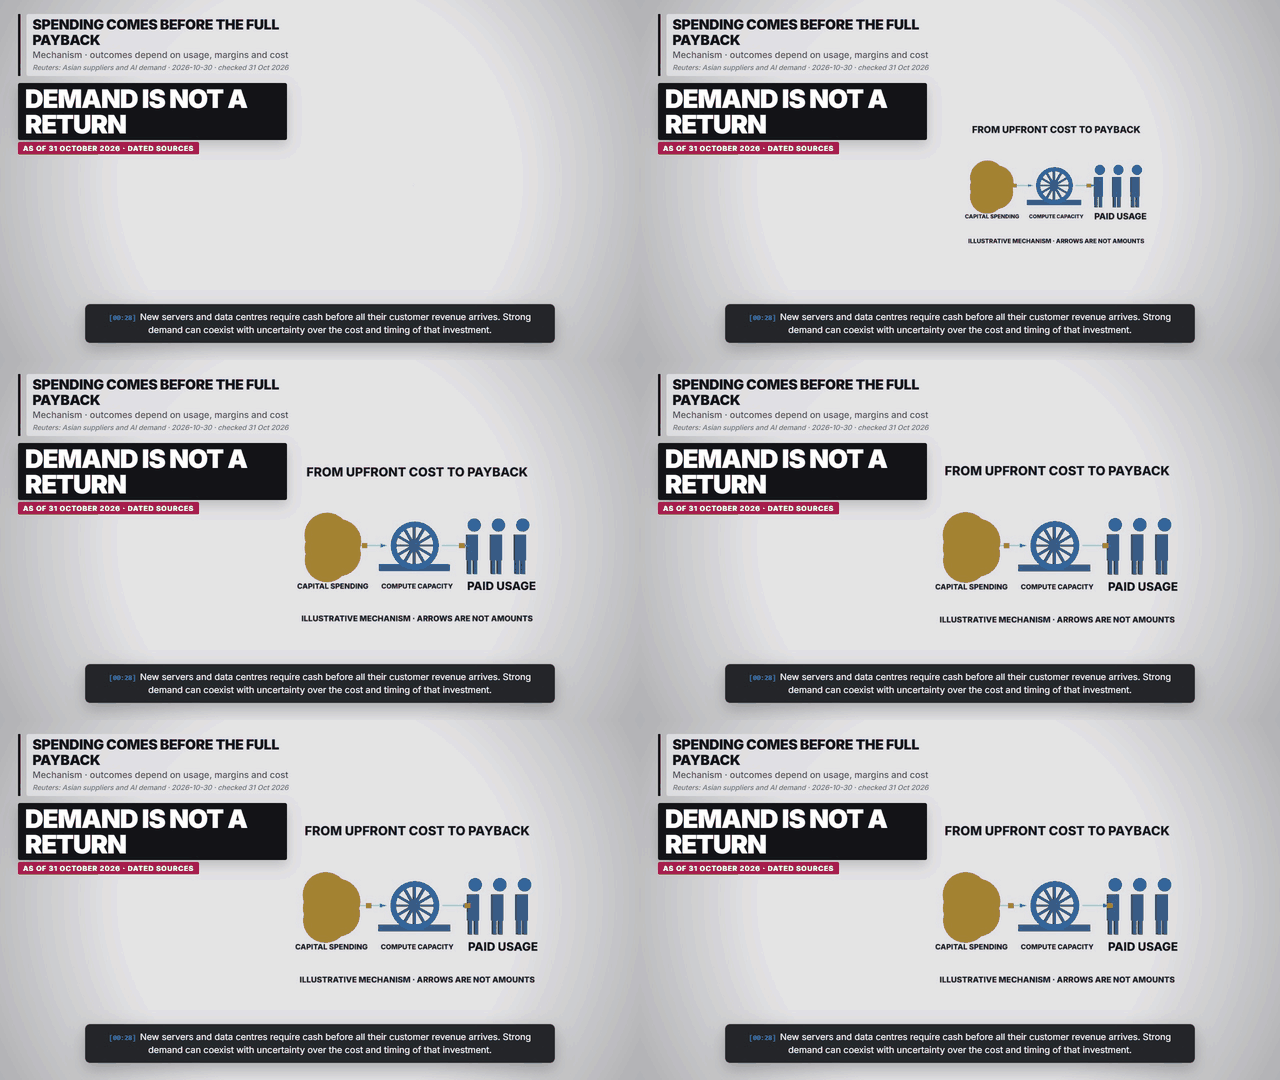
Suppliers can sell more equipment while investors question the returns earned by its buyers. Our interpretation is that orders and investment payback answer different questions. Capacity must earn enough over its useful life to justify the initial cost. Source and qualifications.
Charts, maps and diagrams from the explainer

Frequently asked questions
Did AI demand collapse?
The sell-off alone does not establish that. Supplier executives continued to describe strong AI demand.
What do the percentages measure?
Changes in share prices or index levels from the previous US session close on 30 October 2026.
Sources and reporting scope
Reuters: Wall Street close, 30 October. 2026-10-30. Final US session close; daily price changes, not company revenue changes.
Reuters: Asian suppliers and AI demand. 2026-10-30. Management statements, market reaction and full-year operating-profit forecast.
Checked 31 October 2026. Market figures refer to the final US close on 30 October 2026 and are daily percentage changes. Market explanations are attributed reporting, not proof of a single cause. Diagrams are illustrative. Re-check before re-rendering.