Alphabet: Google Cloud Doubles as Spending Soars
Alphabet’s Q3 2026 results explained: revenue up 25% to $127.6 billion, Google Cloud up 103% to $30.7 billion and $51.4 billion of capital spending.
Explore the five-scene explainerKey takeaways
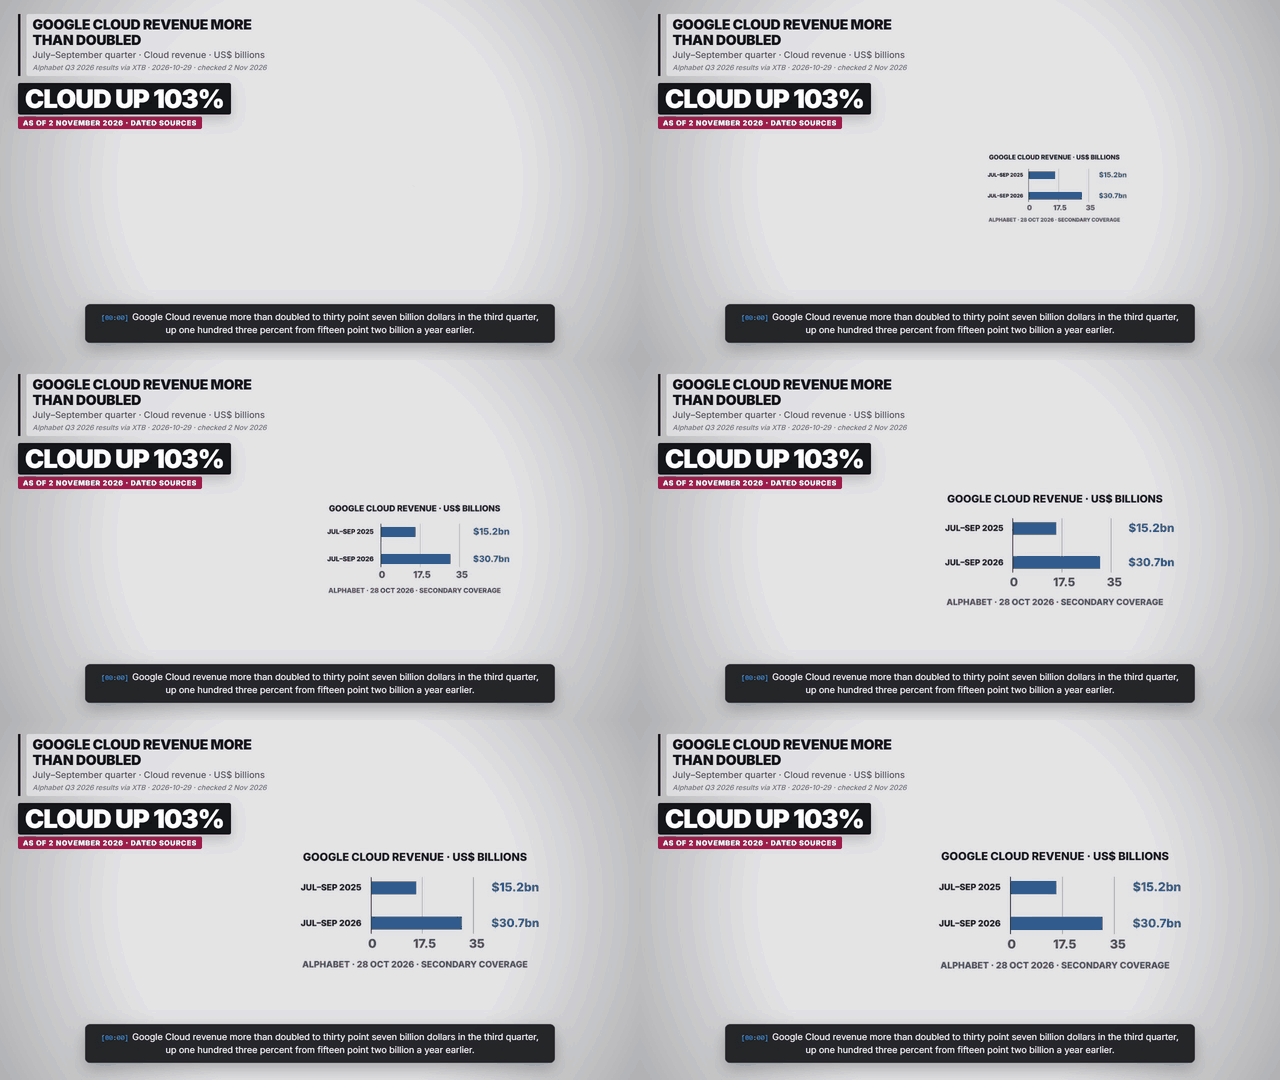
- Revenue rose 25% to $127.6 billion; Google Cloud revenue rose 103% to $30.7 billion.
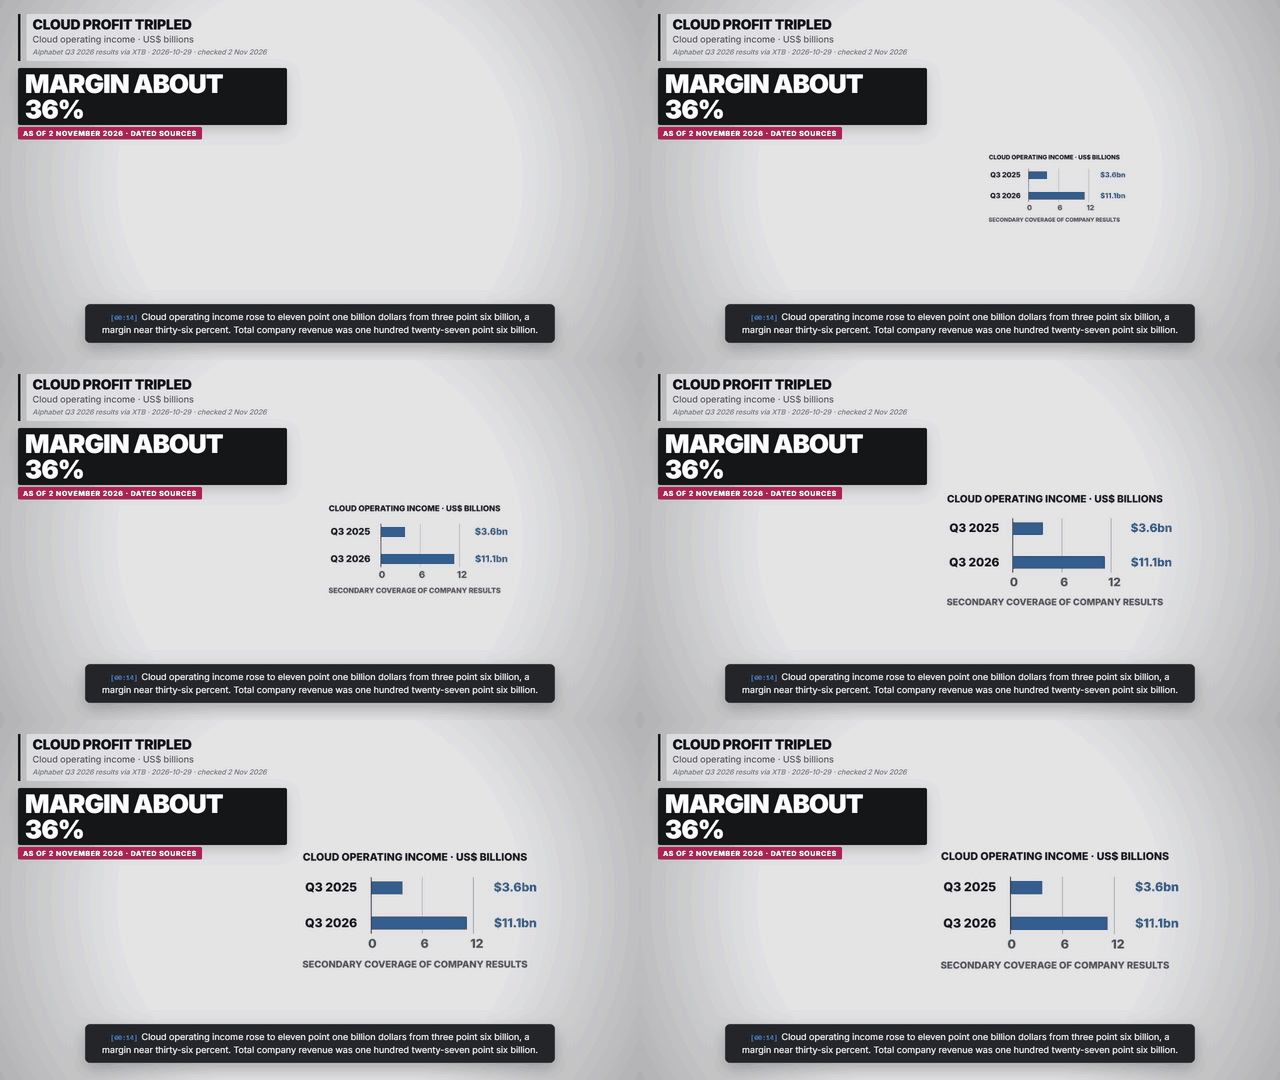
- Cloud operating income rose to $11.1 billion from $3.6 billion, a margin of about 36%.
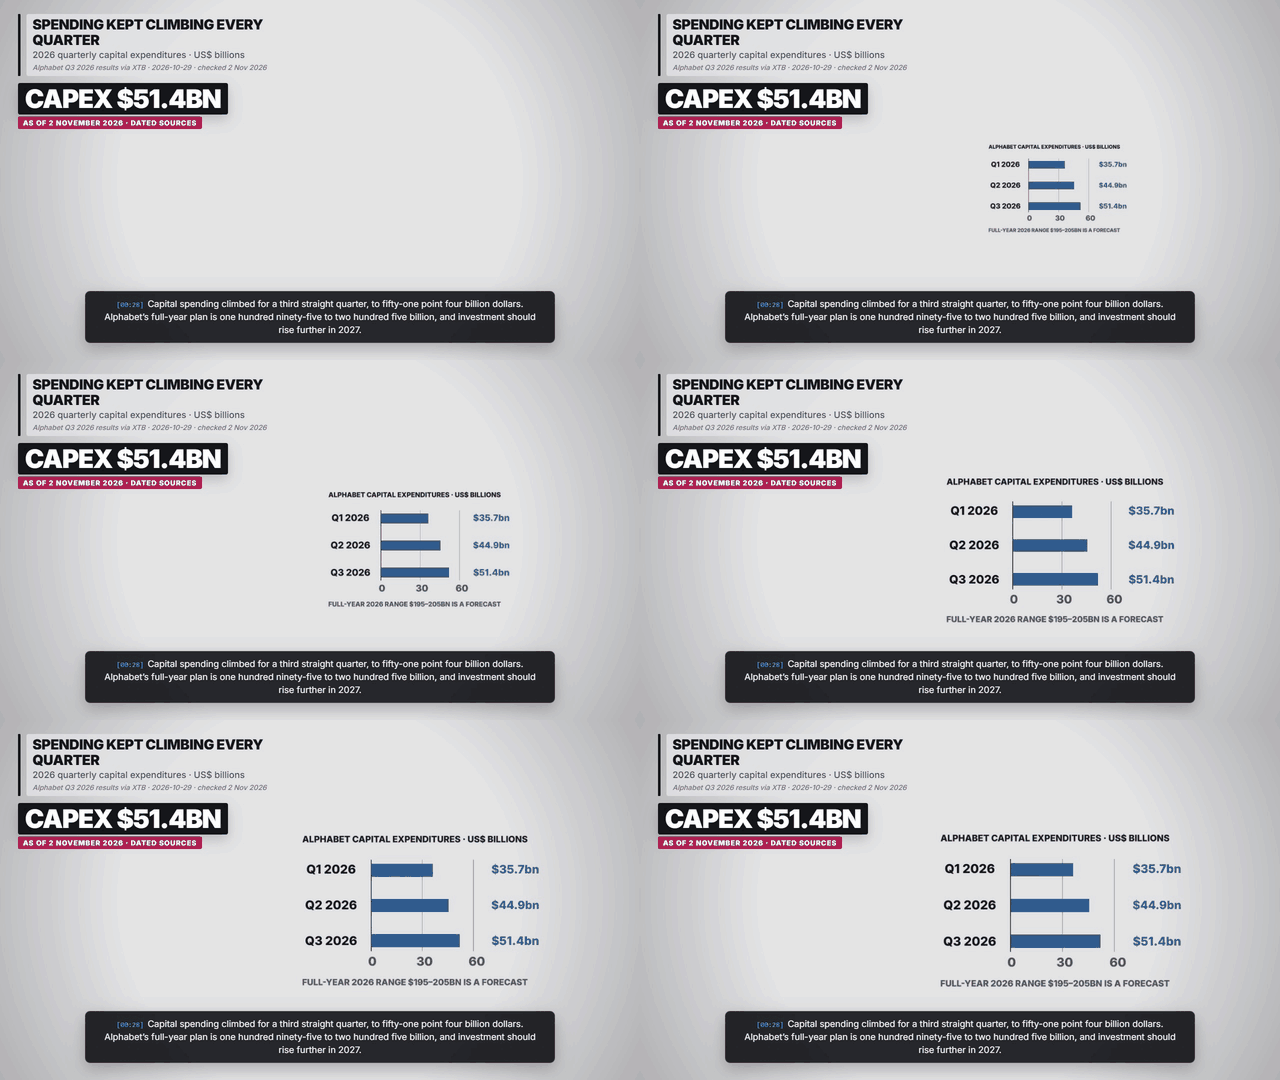
- Capital spending was $51.4 billion in the quarter, up from $35.7 billion in Q1 and $44.9 billion in Q2; Alphabet’s 2026 range is $195–205 billion.
Sourced figures and status
| Period | Figure or status | Source |
|---|---|---|
| Q3 2025 → Q3 2026 | Google Cloud revenue: $15.2 billion → $30.7 billion (+103%). | XTB: Alphabet disappoints Wall Street despite record results · 2026-10-29 |
| Q3 2025 → Q3 2026 | Google Cloud operating income: $3.6 billion → $11.1 billion (margin about 36%). | XTB: Alphabet disappoints Wall Street despite record results · 2026-10-29 |
| Q3 2026 | Total revenue $127.6 billion (+25% year on year). | XTB: Alphabet disappoints Wall Street despite record results · 2026-10-29 |
| Q1 → Q3 2026 | Quarterly capital expenditures: $35.7 billion → $44.9 billion → $51.4 billion. | XTB: Alphabet disappoints Wall Street despite record results · 2026-10-29 |
| 2026 outlook | Capital expenditures of $195–205 billion; investment expected to rise significantly in 2027. Forecast. | Quartr: Alphabet Q3 2026 earnings summary · 2026-10-28 |
Why did shares fall on record results?
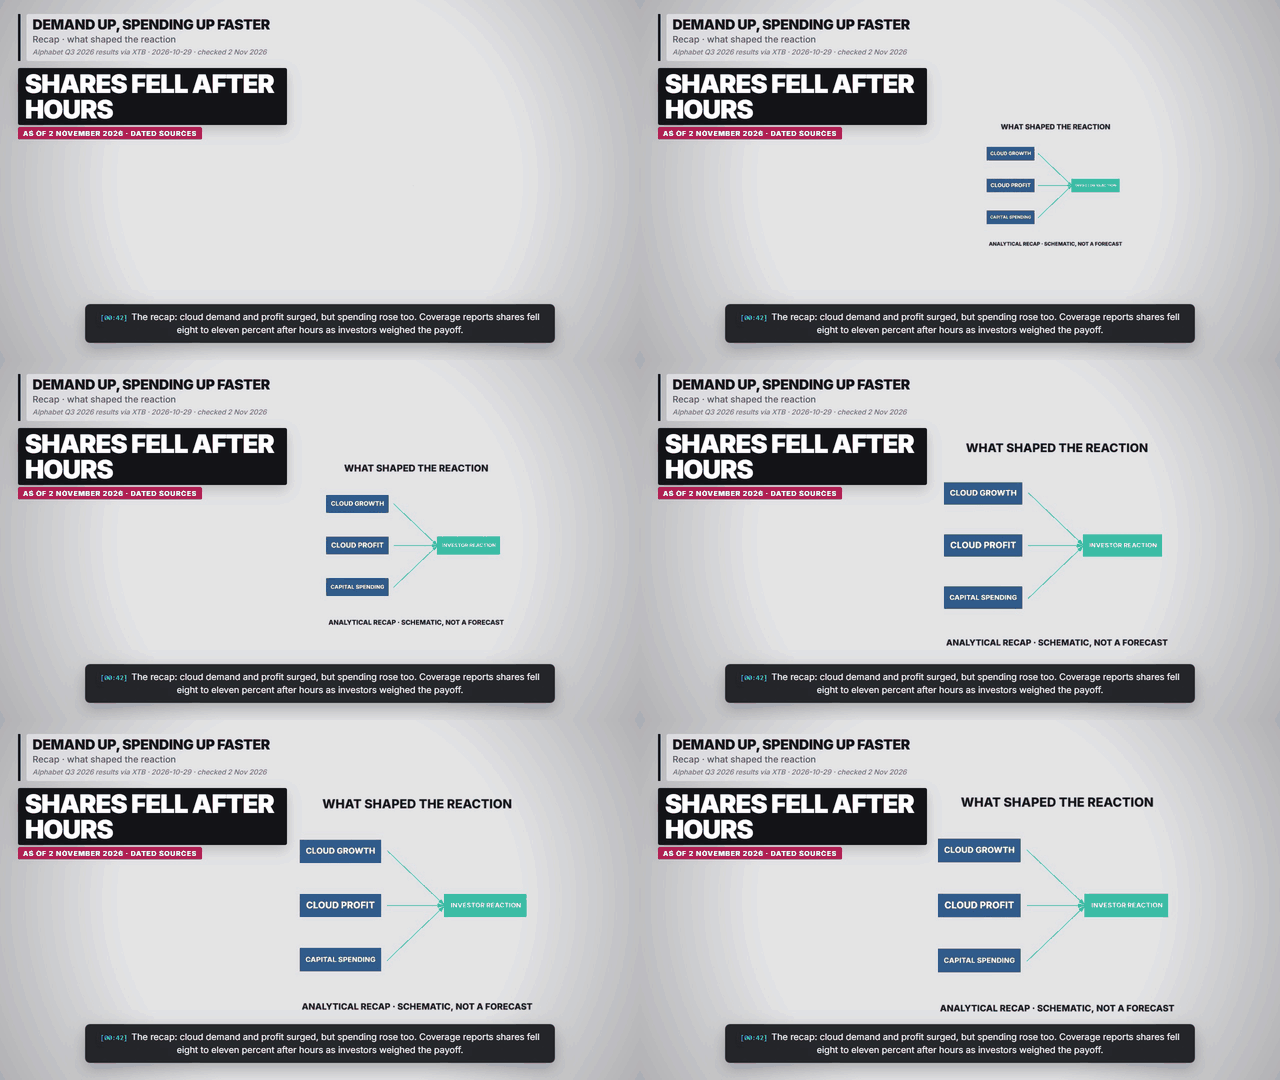
Coverage reports shares fell roughly 8% to 11% after hours as investors weighed record growth against heavy spending. Net income fell because of equity-investment losses, so the quarter mixed strong cloud demand with weaker reported profit. This is a market reaction reported by outlets, not a company statement. Source and qualifications.
What is not included here?
Reports differ on free cash flow, backlog and 2027 spending. Those figures are excluded until Alphabet’s own filing is checked. Source and qualifications.
Charts, maps and diagrams from the explainer
Frequently asked questions
Did Google Cloud really double?
Reported revenue rose 103% year on year, from $15.2 billion to $30.7 billion.
Is $195–205 billion already spent?
No. It is Alphabet’s forecast range for full-year 2026 capital expenditures.
Was the sell-off a result or a forecast?
It was a share-price reaction in after-hours trading to the results and spending plans, not part of the reported results.
Sources and reporting scope
XTB: Alphabet disappoints Wall Street despite record results. 2026-10-29. Secondary market coverage of Alphabet’s Q3 2026 results released 28 October 2026; share-price moves are after-hours reactions, not closing prices.
Quartr: Alphabet Q3 2026 earnings summary. 2026-10-28. Earnings-event summary; backlog, EPS and 2027 capital-spending figures differ between outlets and are not used as headline figures.
Checked 2 November 2026. Alphabet’s third quarter of 2026 ended 30 September; results were released on 28 October 2026. Figures are in US dollars and come from secondary coverage of the company release; Alphabet’s own filing should be checked before re-rendering. Free cash flow, backlog and 2027 spending figures differ between outlets and are left out of the scenes. The full-year capital-spending range is a forecast.