Eurozone: Growth Slows but the PMI Stays Above 50
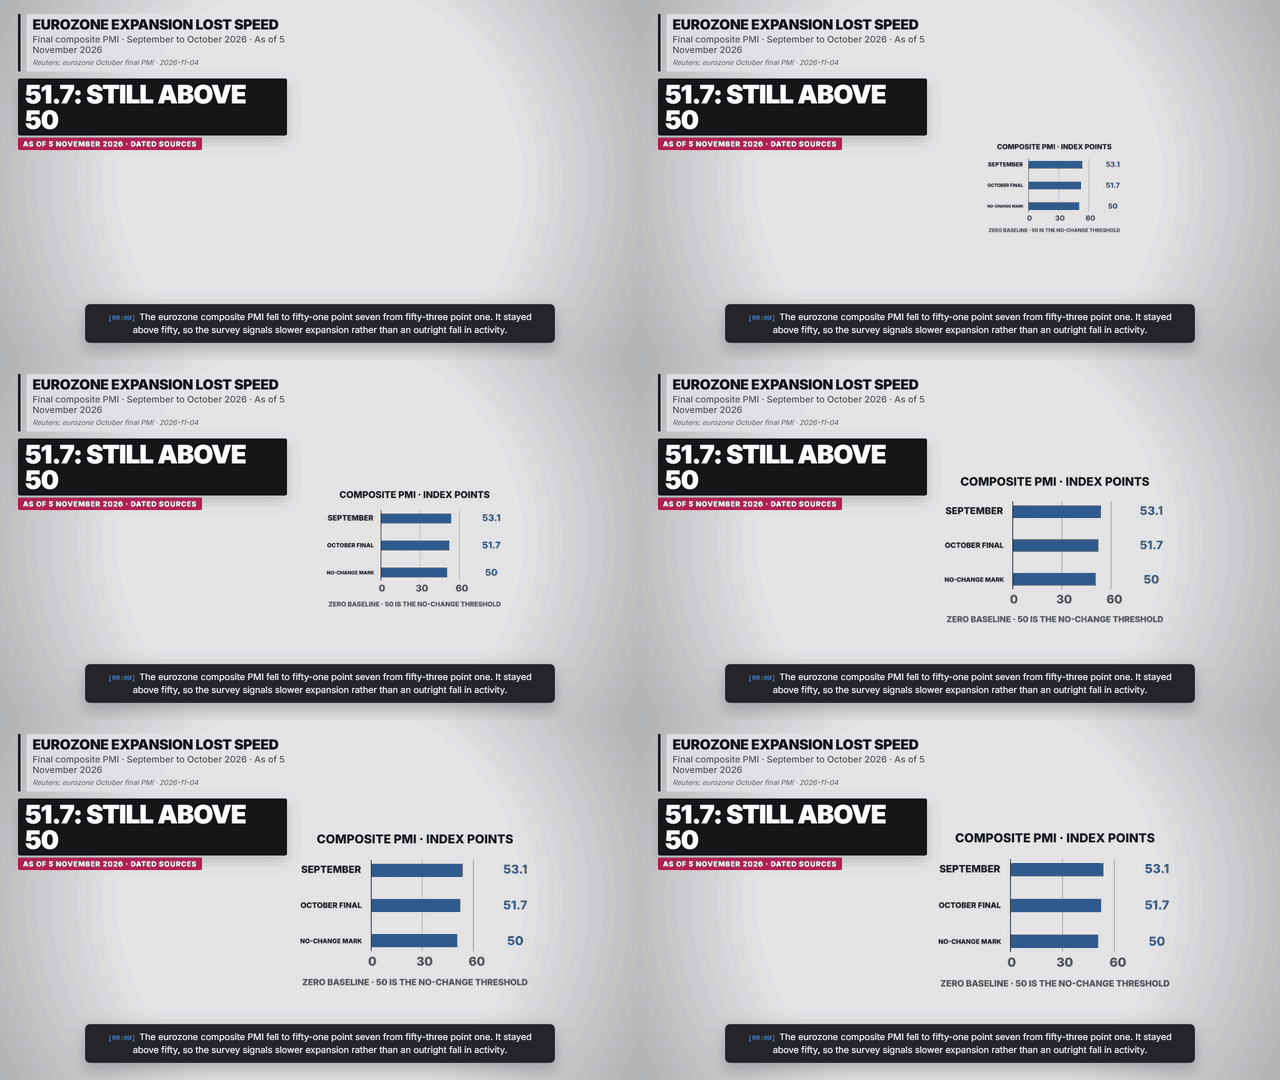
The eurozone composite PMI fell to 51.7 in October from 53.1 in September. What slower expansion, weaker demand and the survey’s 50 threshold mean.
Explore the five-scene explainerKey takeaways
- The composite index remained above the no-change threshold.
- The final October reading replaces the preliminary estimate.
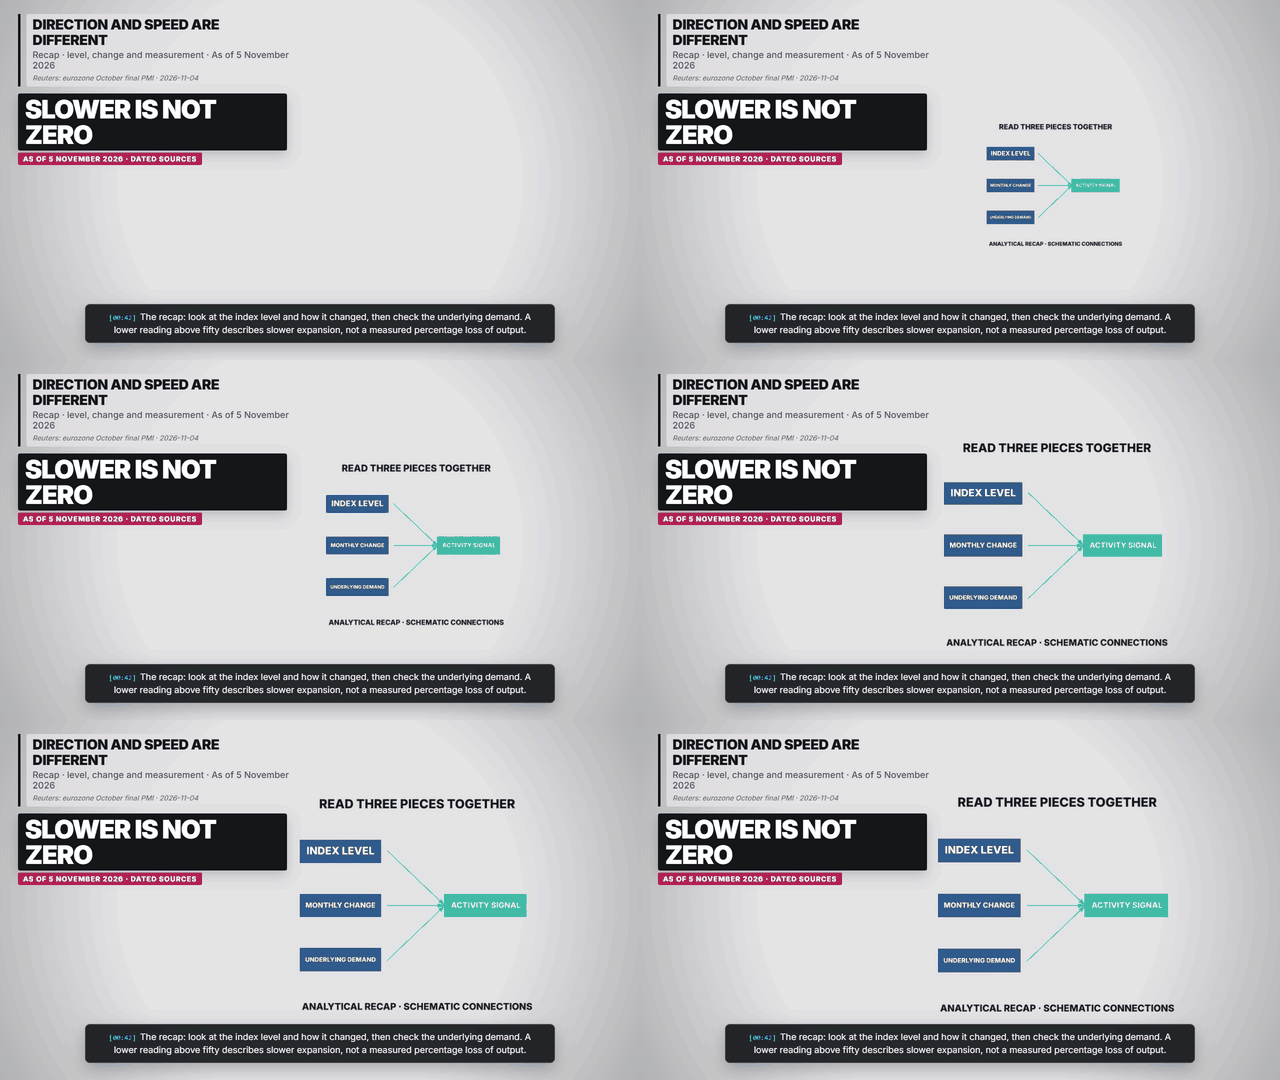
- PMI points are not percentage GDP growth.
Sourced figures and status
| Period | Figure or status | Source |
|---|---|---|
| Sept / Oct 2026, final composite | 53.1 / 51.7 index points; October flash estimate was 51.9. | Reuters: eurozone October final PMI · 2026-11-04 |
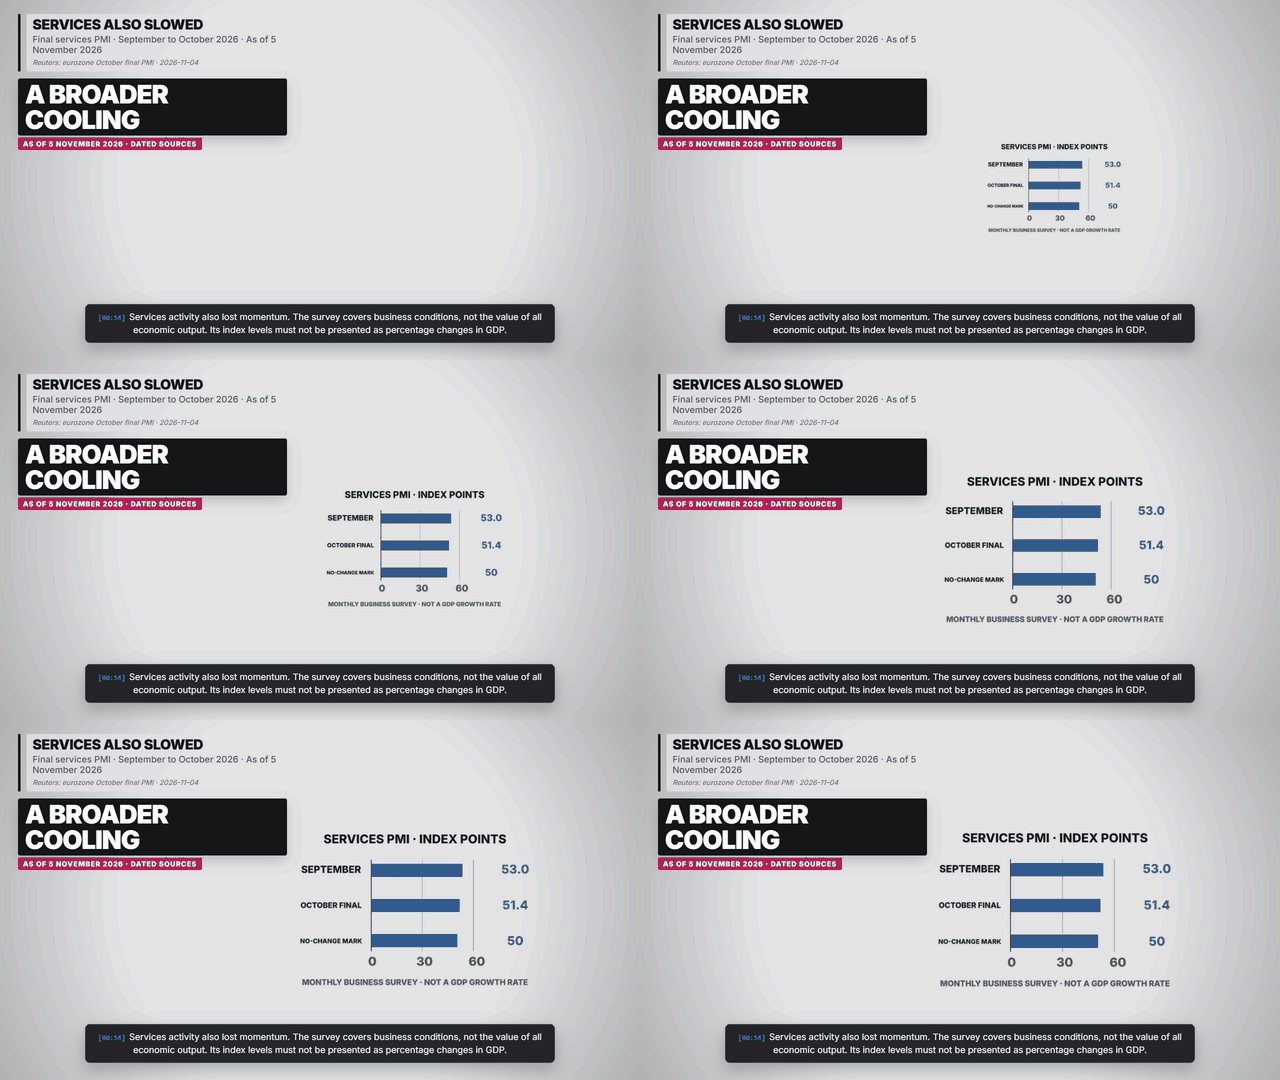
| Sept / Oct 2026, final services | 53.0 / 51.4 index points; 50 is the no-change threshold. | Reuters: eurozone October final PMI · 2026-11-04 |
Why distinguish direction from speed?
Think of expansion as a direction and momentum as a separate question. A reading can decline while remaining on the expansion side of the survey threshold. Our comparison keeps the zero baseline and prints the values so a small change is not exaggerated by a cropped axis. Source and context.
Why avoid treating the PMI as GDP?
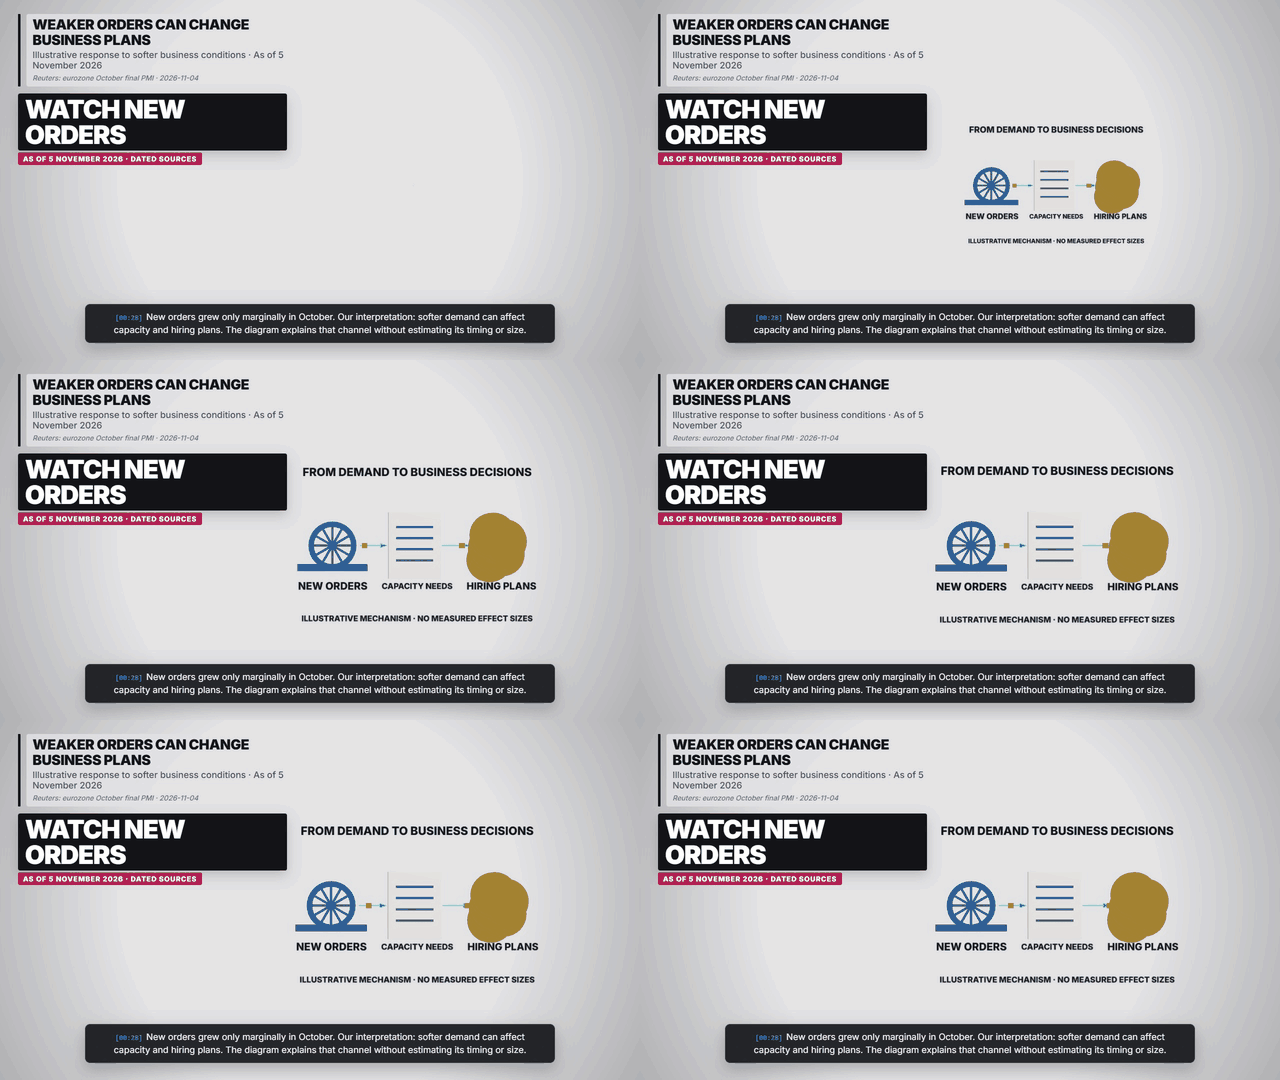
The survey records changes in business conditions. National accounts measure economic output using a different framework and reporting period. Converting an index reading into a precise GDP percentage requires an additional model; this page makes no such conversion. Source and context.
Charts, maps and diagrams from the explainer
Frequently asked questions
Does 51.7 mean 1.7% GDP growth?
No. It is a survey index reading. Its distance from 50 is not a GDP growth percentage.
Is October a contraction in this survey?
The final composite reading remains above 50, indicating expansion at a slower pace.
Sources and reporting scope
Reuters: eurozone October final PMI. 2026-11-04. Final October composite and services survey readings; index points, not GDP growth percentages.
As of 5 November 2026. Final data published on 4 November. Final October PMI readings are survey indexes, not measured GDP growth rates. Composite PMI fell from 53.1 to 51.7; services fell from 53.0 to 51.4. Above 50 indicates monthly activity growth in the survey. The composite’s 51.9 flash estimate has been superseded by 51.7. Diagrams are explanatory, not a recession forecast. Re-check before re-rendering.