Intel: Stronger Sales, a Softer Outlook
Intel’s Q3 2026 revenue growth, divergent data-centre and PC demand, and its $15–16 billion Q4 revenue forecast explained.
Explore the five-scene explainerKey takeaways
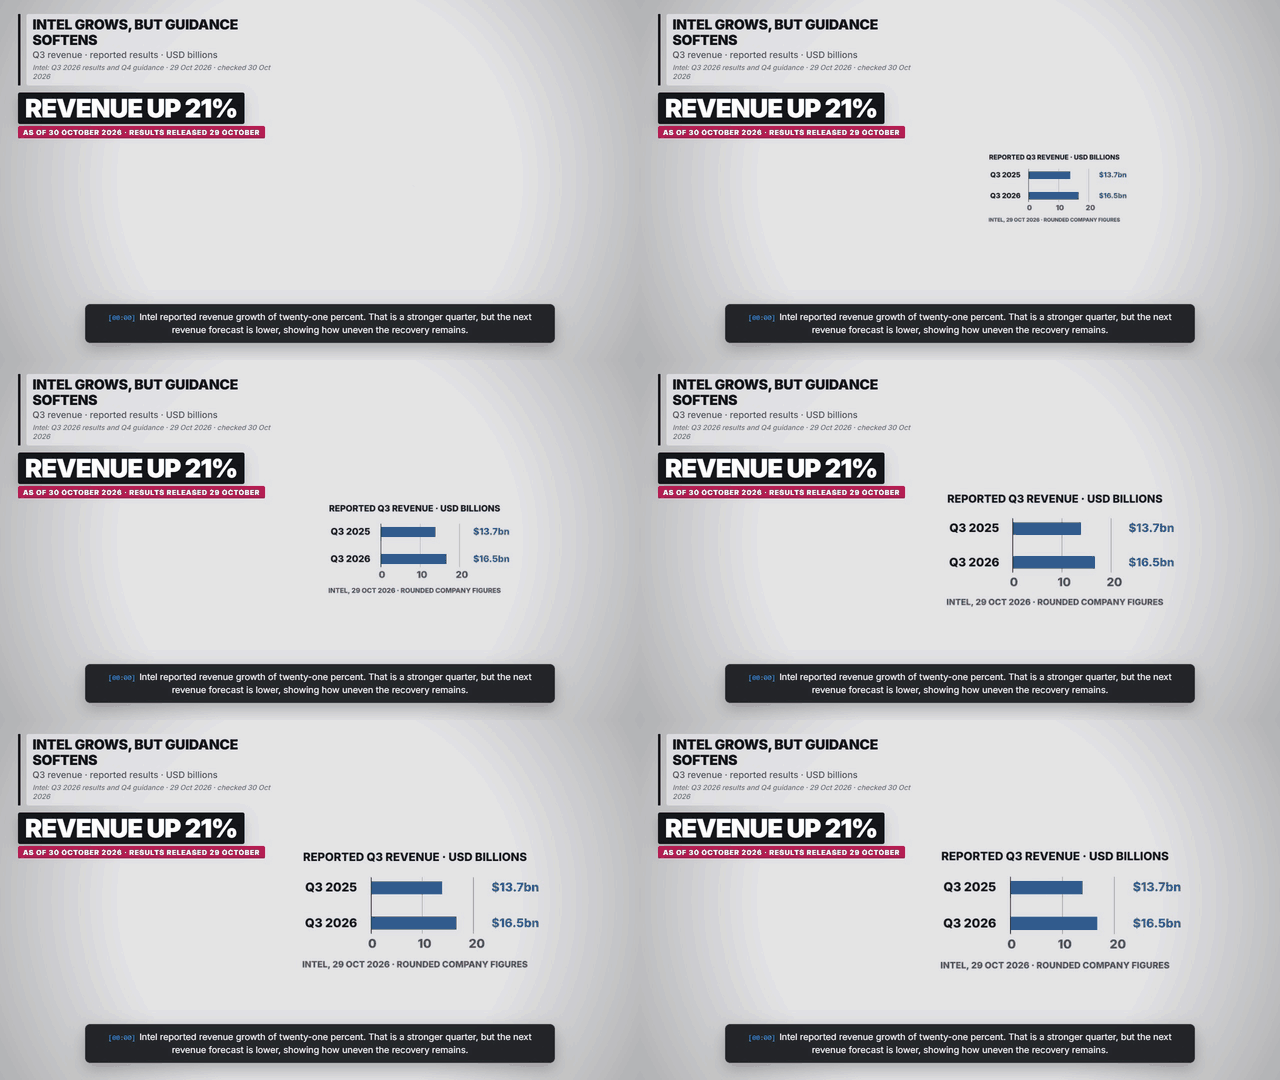
- Intel reported Q3 revenue of $16.5 billion, up 21% from the rounded $13.7 billion a year earlier.
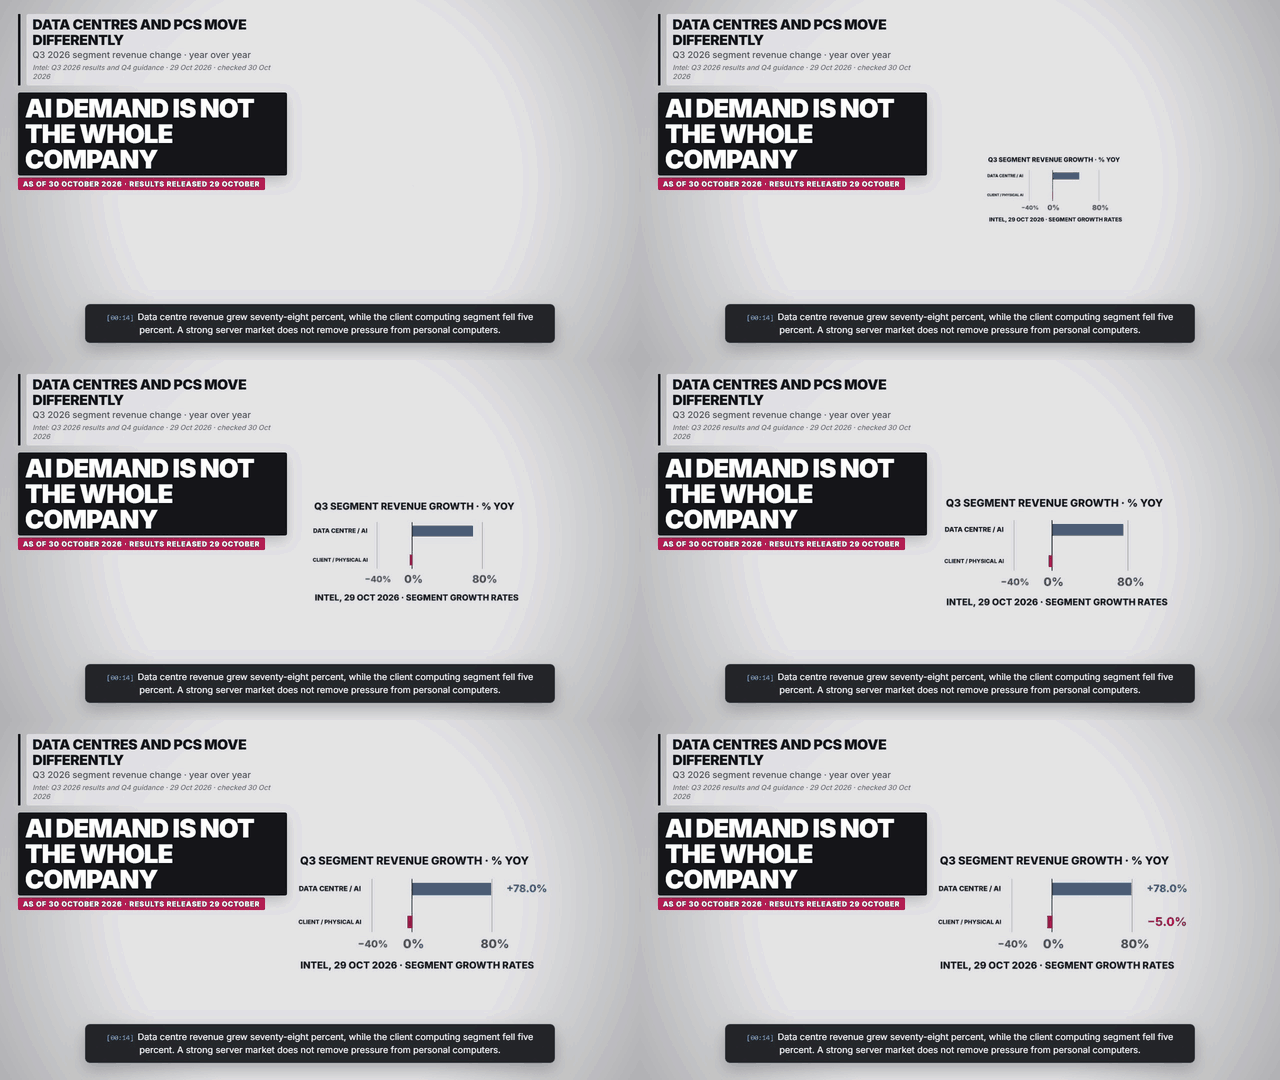
- Data Center and AI revenue grew 78% while Client Computing and Physical AI revenue fell 5%, showing divergent markets.
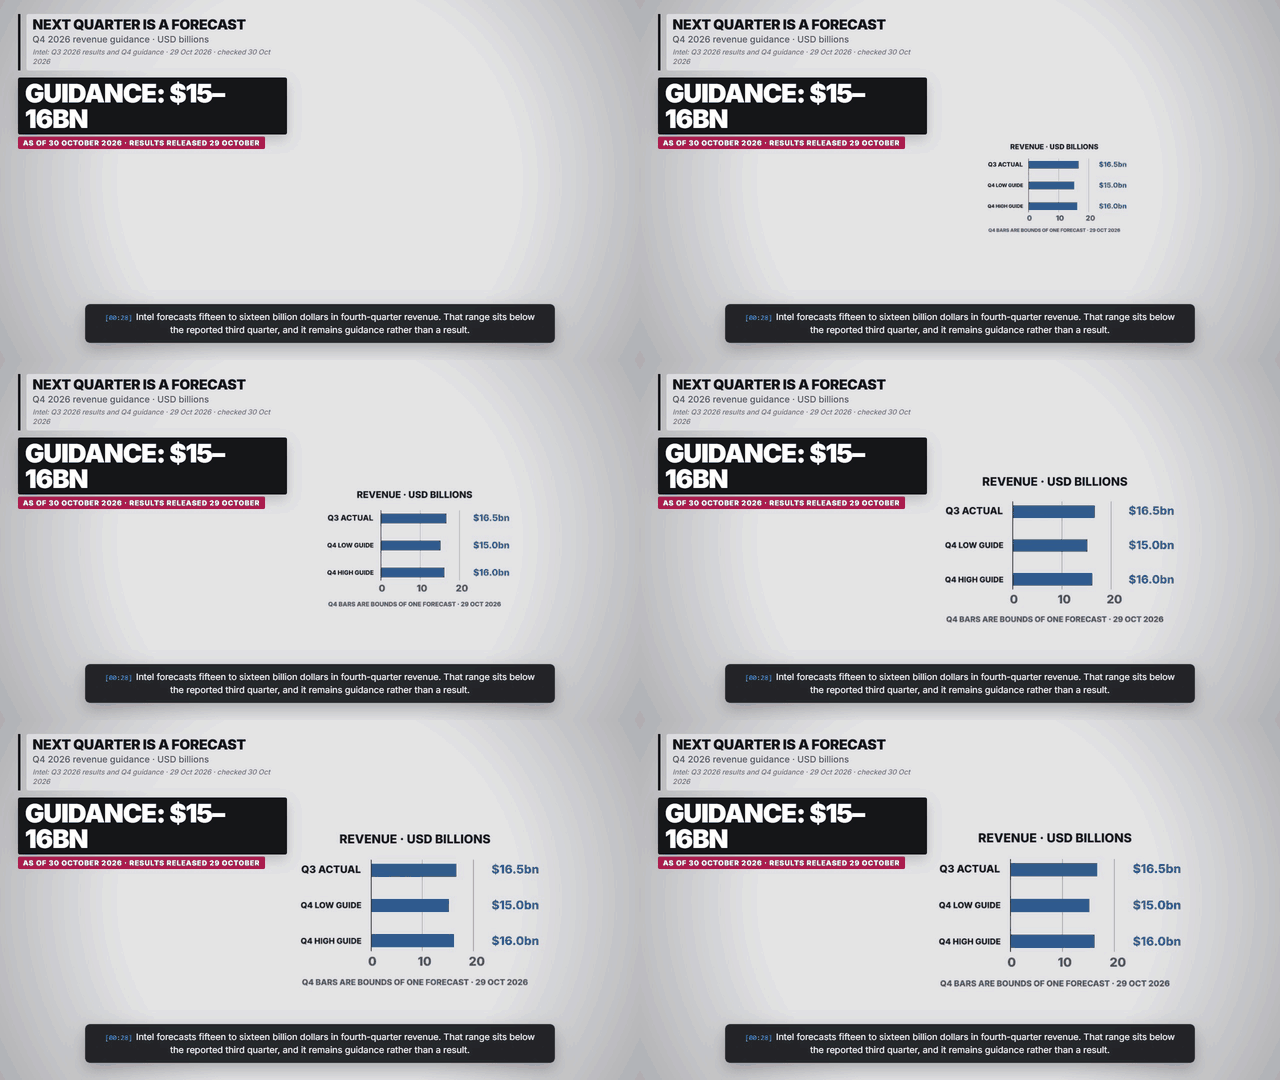
- Q4 revenue guidance is $15.0–16.0 billion. Both bounds are below Q3 revenue, but they are forecasts rather than outcomes.
Sourced figures and status
| Period | Figure or status | Source |
|---|---|---|
| Q3 ended 26 Sep 2026; Q3 2025 comparator | Consolidated revenue: $16.5 billion vs $13.7 billion, up 21% (rounded company figures). | Company release, 29 October 2026 |
| Q3 2026 vs Q3 2025 | Data Center and AI revenue growth: +78%. | Company release, 29 October 2026 |
| Q3 2026 vs Q3 2025 | Client Computing and Physical AI revenue growth: −5%. | Company release, 29 October 2026 |
| Q4 2026 outlook published 29 Oct 2026 | Revenue guidance: $15.0–16.0 billion; management forecast. | Company release, 29 October 2026 |
A stronger reported quarter
Intel’s consolidated revenue rose year over year. That describes the completed third quarter; it does not imply revenue must rise in every following quarter. The chart uses rounded company figures and a common zero baseline. Company results and qualifications.
Two markets inside one company
Data-centre revenue is growing rapidly, while the client-computing business faces weaker demand. The growth chart compares each segment with its own prior-year revenue. It does not compare market size or add the growth rates into a company total. Company results and qualifications.
The outlook shows the tension
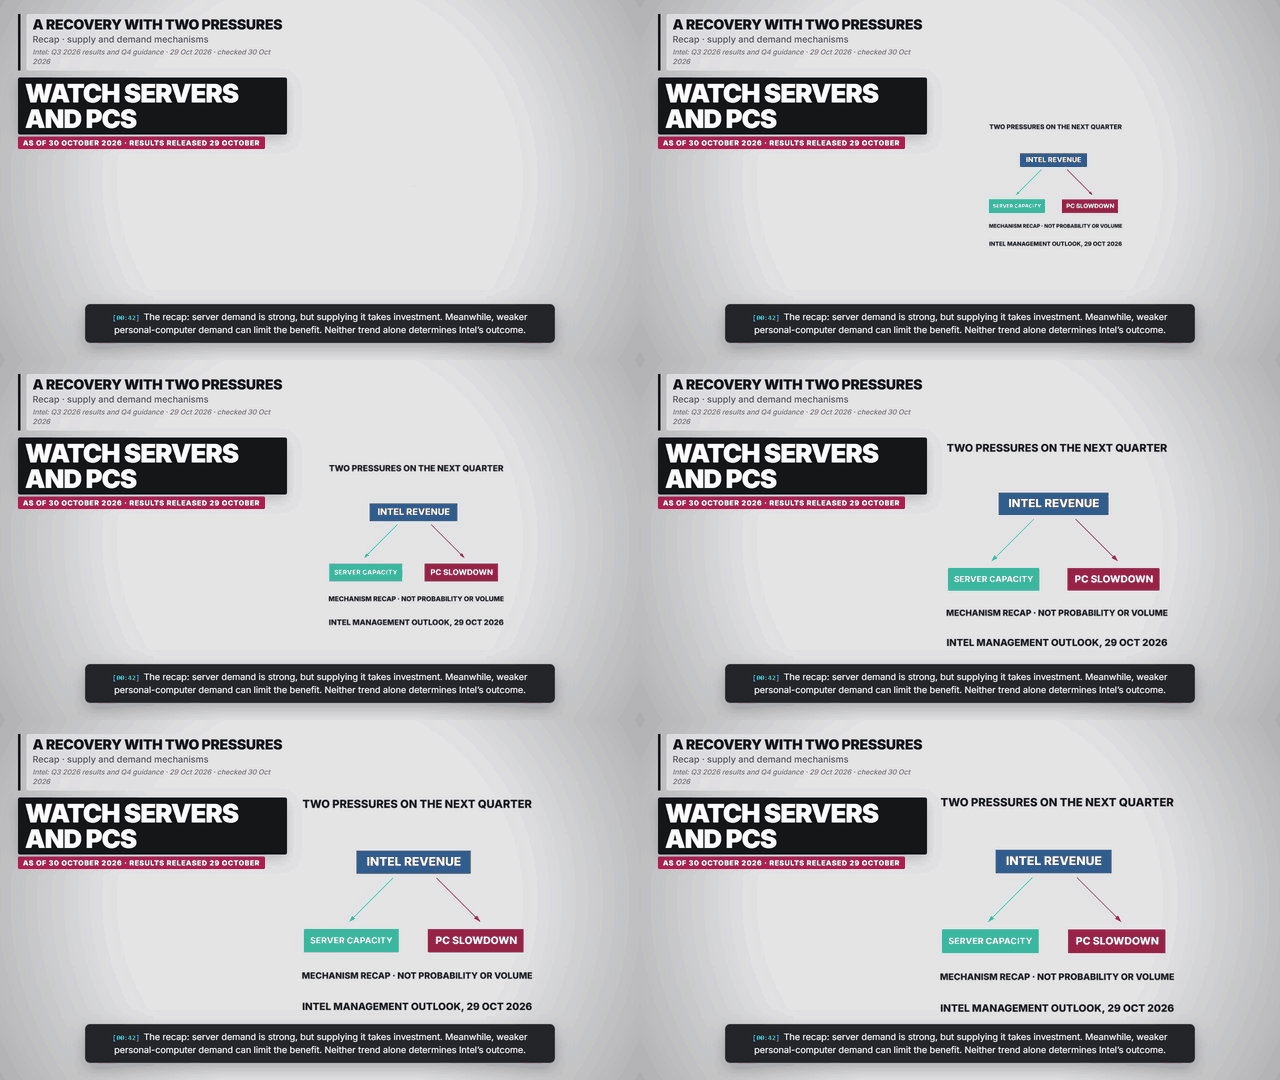
Management forecasts fourth-quarter revenue below the reported third quarter. It also describes a need to expand server supply and continuing PC weakness. These expectations reflect conditions at the time of the release and remain subject to execution and market changes. Company results and qualifications.
How to read the forecast chart
The low and high guidance bars mark the endpoints of a single range. They are not two sales streams. Segment results may include intersegment transactions, so the explainer avoids summing them into consolidated revenue or treating a roadmap as completed production. Company results and qualifications.
Charts, maps and diagrams from the explainer
Frequently asked questions
Are the Q4 figures reported revenue?
No. The $15.0–16.0 billion range is Intel’s forecast issued on 29 October 2026.
How fast did Intel’s revenue grow?
Intel reported 21% year-over-year Q3 revenue growth, to $16.5 billion, using rounded company figures.
Why did strong AI demand not remove all weakness?
Intel serves multiple markets. Data Center and AI revenue grew 78%, while Client Computing and Physical AI revenue fell 5%.
Sources and reporting scope
Intel: Q3 2026 results and Q4 guidance. 2026-10-29. Q3 ended 26 September 2026. Q4 figures are forecasts; GAAP and non-GAAP measures differ.
Checked 30 October 2026. Intel released Q3 results on 29 October for the quarter ended 26 September 2026. Q4 guidance is a forecast, not a result. The Q4 low and high bars are bounds of one forecast, not additive revenues. Segment revenue can include intersegment transactions; segment growth rates cannot be added. Revenue comparisons use rounded company figures. Recap diagrams do not encode probabilities or volumes. Re-check before re-rendering.