The Diplomatic Push to Prevent More War with Iran
Who is meeting in Tehran, what diplomacy can establish and why the Strait of Hormuz matters. Dated reporting and historical oil-flow context, checked 26 October 2026.
▶ Explore the narrated graphic explainerKey takeaways
- Delegations are meeting in Tehran with de-escalation as the stated aim.
- A diplomatic meeting, an agreement and implementation require different evidence.
- Hormuz’s historical oil-flow scale explains attention to shipping without supplying a live status.
The dated facts and their scope
| Period or item | Reported fact or figure | Scope | Source |
|---|---|---|---|
| 26 October 2026 | Saudi, Pakistani and Turkish delegations | Reported Tehran meetings; not a settlement | AP: Delegations meet in Tehran |
| 2024 | 20.7 million barrels/day | Historical Hormuz petroleum-liquids flow | EIA: World oil transit chokepoints |
| First half 2025 | 20.9 million barrels/day | Same EIA measure; not current traffic | EIA: World oil transit chokepoints |
What is happening in Tehran?
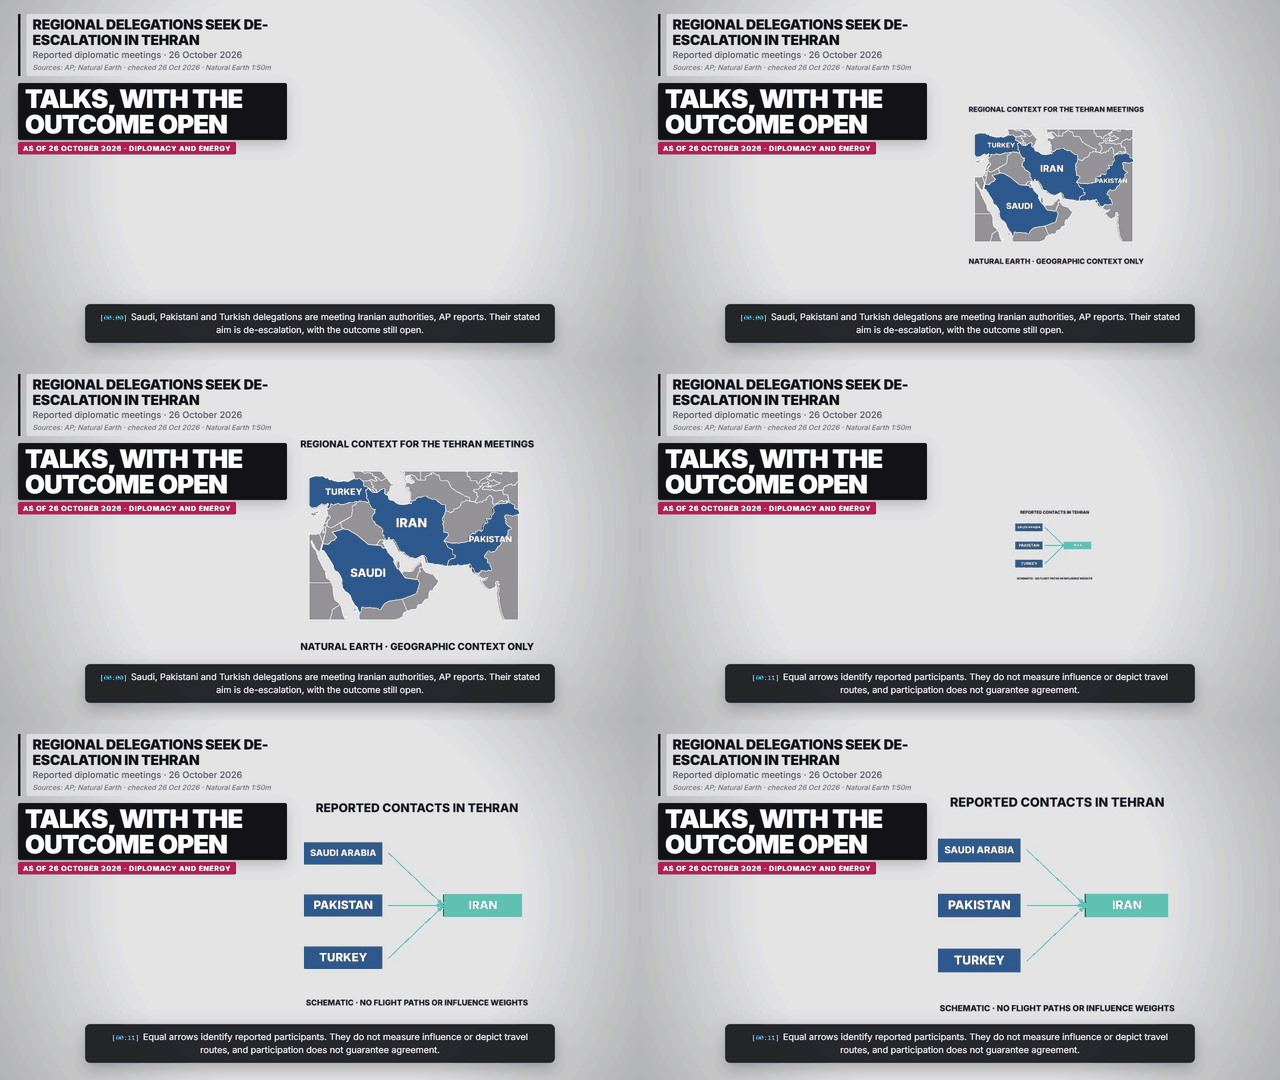
AP reports delegations from Saudi Arabia, Pakistan and Turkey meeting Iranian authorities in a diplomatic effort to avoid renewed fighting. The account records an initiative and attributed aims. It does not establish a signed settlement, a ceasefire or the completion of negotiations. Source: AP: Delegations meet in Tehran.
Why show the participants as a network?
The diagram identifies a destination for reported contacts, with equal arrows. Those arrows do not measure influence, represent flights or imply that all participants share every position. A diplomatic network can describe who is involved while leaving the content and outcome of negotiation unresolved. Source: AP: Delegations meet in Tehran.
Why is Hormuz part of the context?
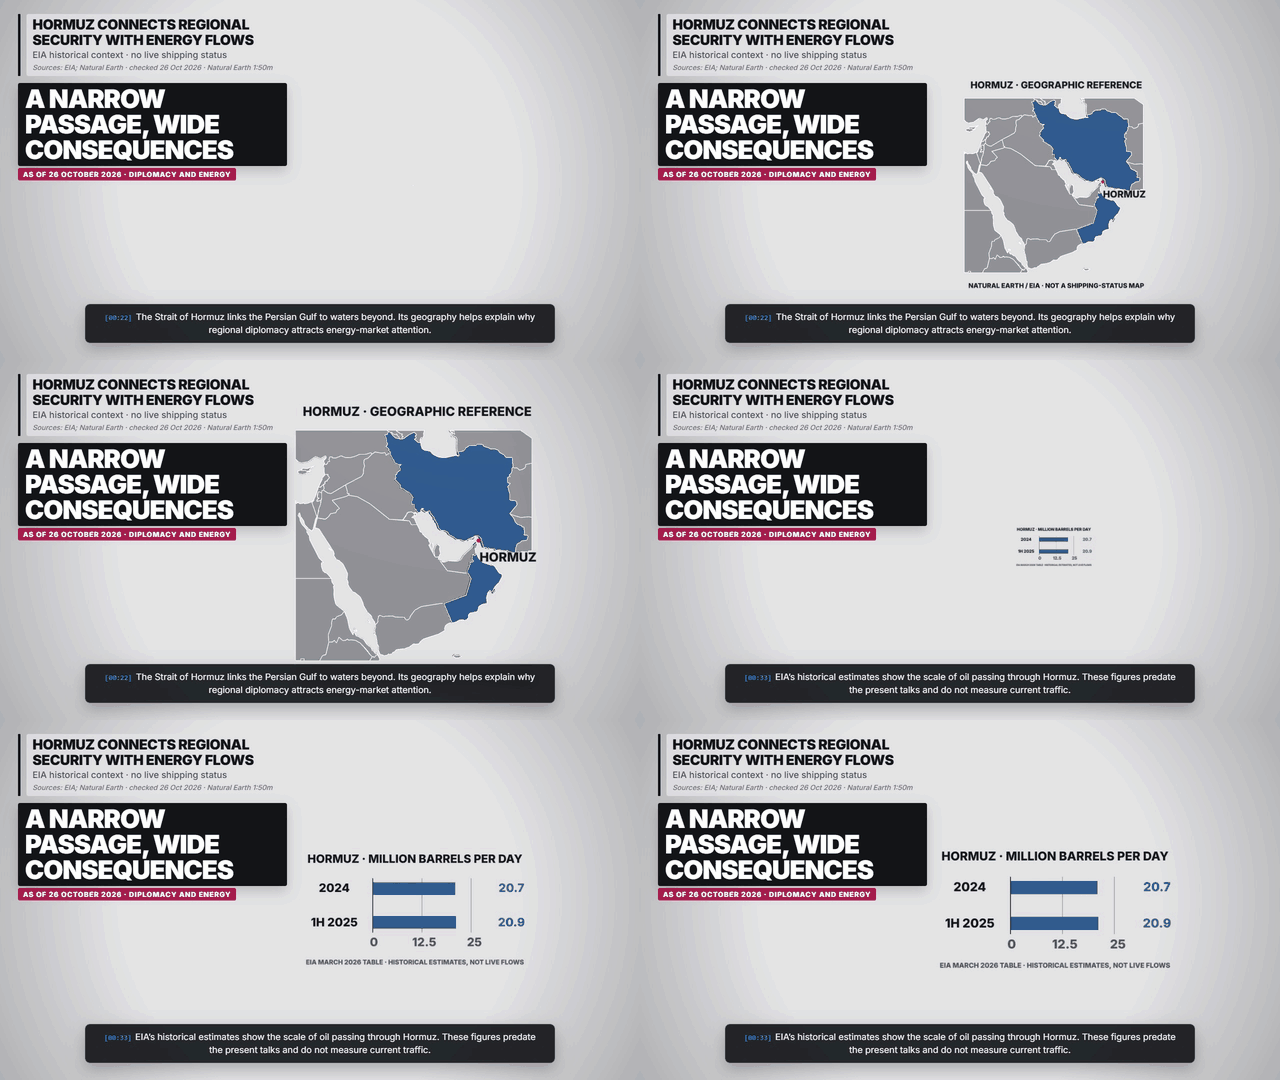
EIA identifies the narrow passage connecting the Persian Gulf with waters beyond as an important oil chokepoint. Its March 2026 table gives historical petroleum-liquids flows of 20.7 million barrels per day for 2024 and 20.9 for the first half of 2025. The chart uses one measure and one zero baseline; it is not an estimate of today’s flow. Source: EIA: World oil transit chokepoints.
What can a shipping diagram explain?
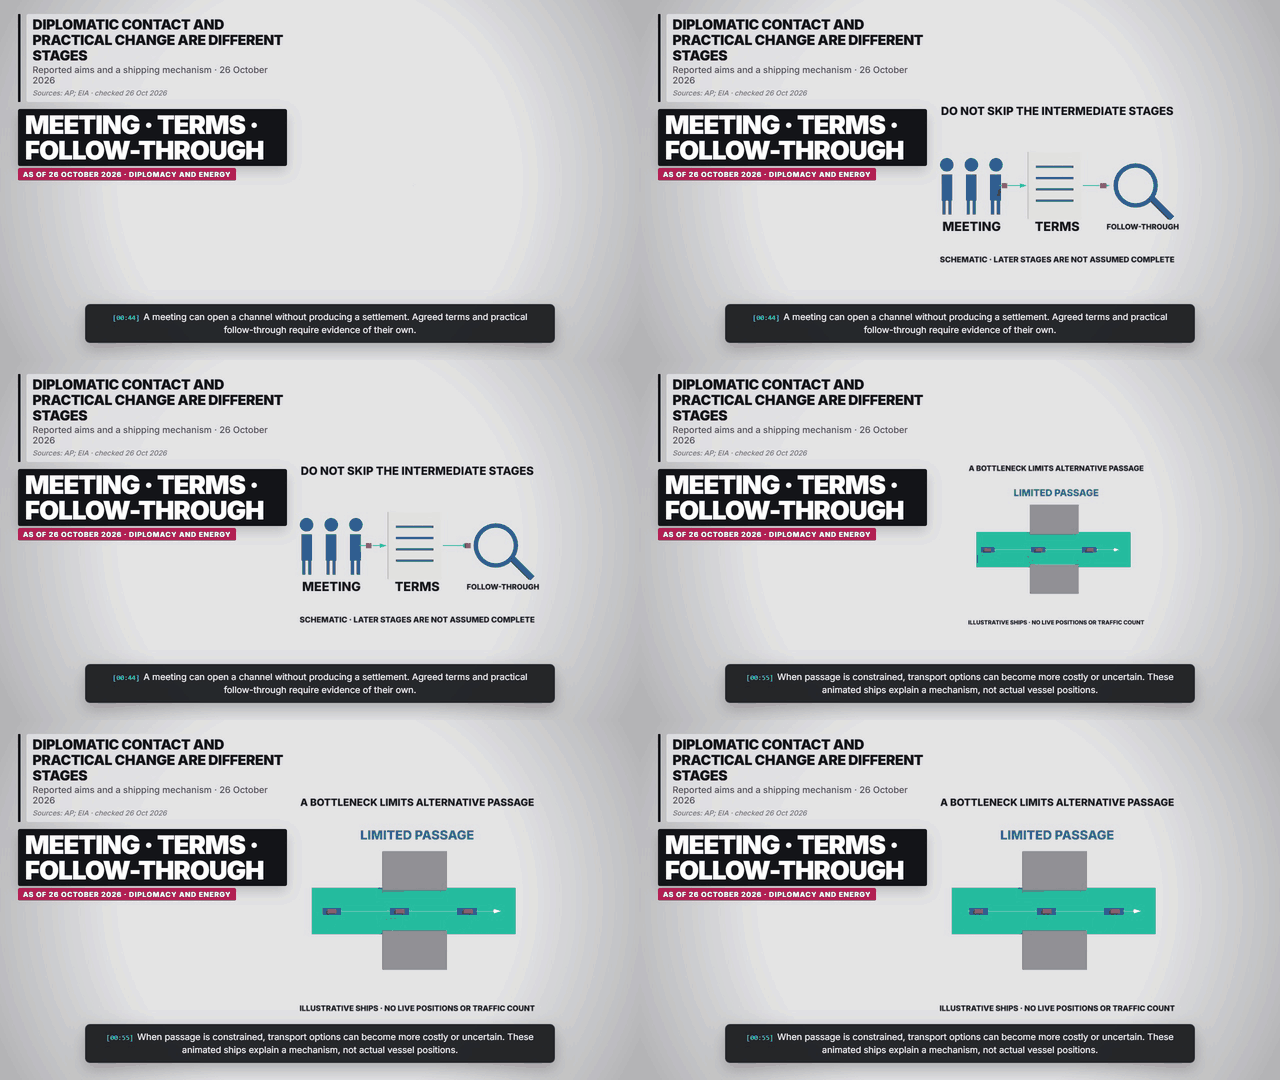
A narrow passage limits alternative routes and can make disruptions consequential for transport and energy markets. The animated ships show a general bottleneck mechanism. Their number, motion and position are illustrative, rather than observations of vessels. This page supplies no route advice or operational clearance. Source: EIA: World oil transit chokepoints.
What would show progress?
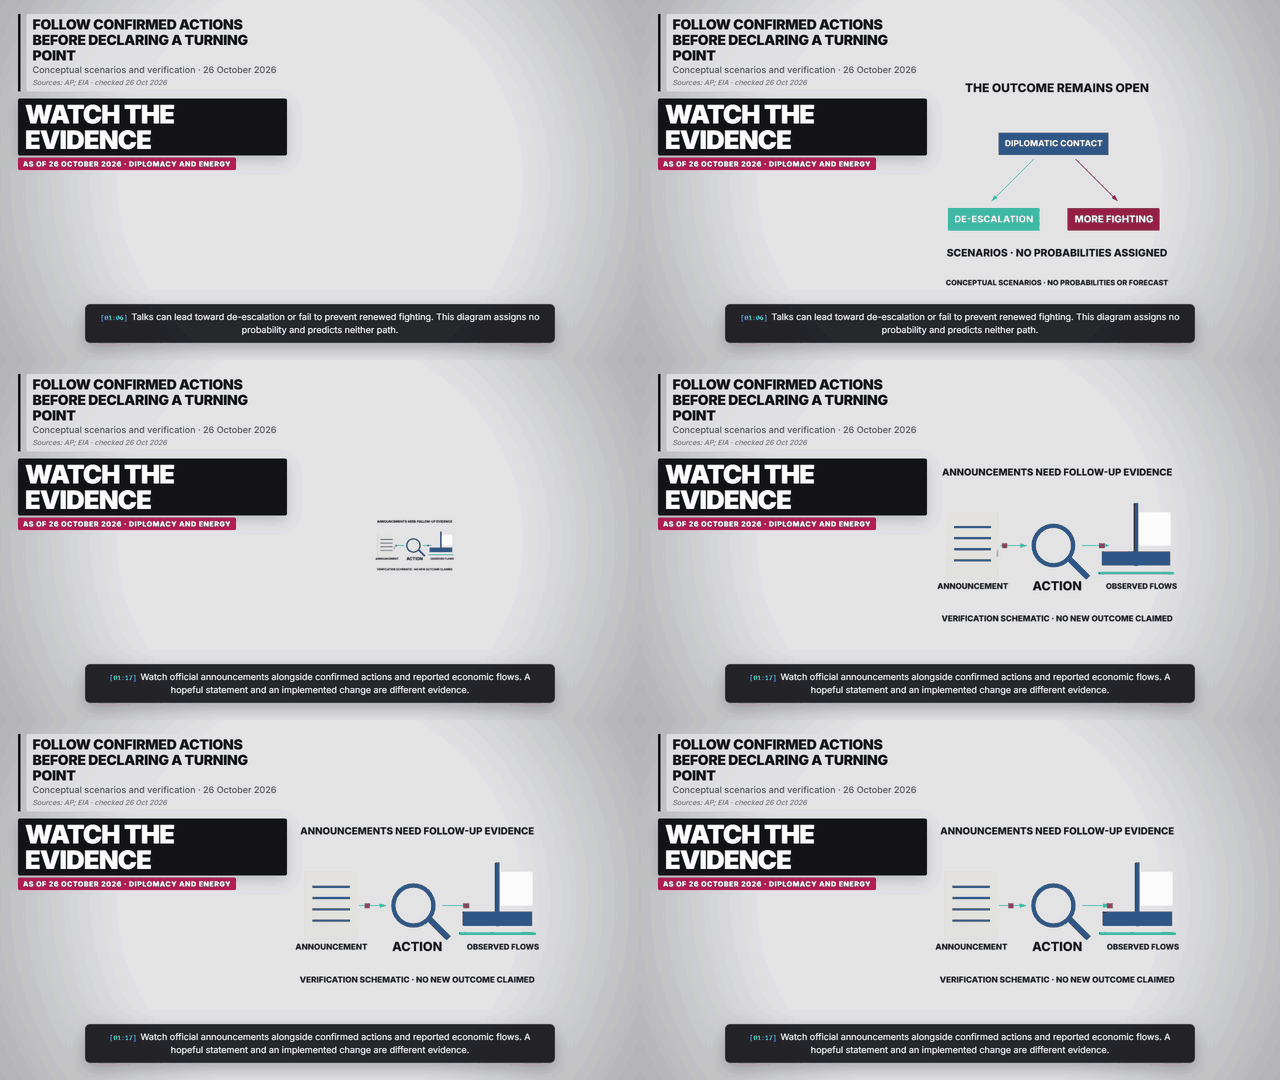
Subsequent evidence could include attributed official statements, agreed terms and independently reported implementation. A statement of intention is an earlier stage than an action that has occurred. The scenario branches illustrate different possible paths without assigning odds, predicting attacks or claiming that any later step has already happened. Source: AP: Delegations meet in Tehran.
How the graphics should be read
The charts and diagrams retain their dates, units and whether a figure is reported, estimated, projected or illustrative. Equal arrows do not encode quantities. Maps locate the subject and use generated country boundaries; they do not supply evidence about individual votes or live movements.
Frequently asked questions
Has a new peace deal been announced here?
No. This snapshot concerns reported diplomatic meetings and their stated aims, not a new signed settlement.
Are the oil bars current tanker traffic?
No. They show EIA historical estimates for 2024 and the first half of 2025.
Do the arrows show flights or military activity?
No. The network is a schematic of reported diplomatic participation.
Charts, maps and diagrams from the explainer
Sources and reporting scope
- AP: Delegations meet in Tehran. 2026-10-26. Reports Saudi, Pakistani and Turkish delegations meeting Iranian authorities to seek de-escalation. A meeting is not an announced settlement.
- EIA: World oil transit chokepoints. Updated 2026-03-03; data 2024 and first half 2025. Hormuz petroleum-liquids flows: 20.7 million barrels/day in 2024 and 20.9 in 1H25. Historical context, not October 2026 traffic.
- Natural Earth: 1:50m country boundaries. v5.1.2; generated 26 Oct 2026. Shared-projection geographic context. Edge territories are clipped; boundaries do not endorse disputed territorial claims. No map shows regional vote results, live shipping or military movements.
As of 26 October 2026. Meetings and stated diplomatic aims are attributed to AP’s reporting and its cited officials. No new ceasefire, signed settlement or verified compliance is asserted. The EIA oil chart uses 2024 and first-half 2025 historical estimates in million barrels per day, not live traffic. Map pins locate Tehran and Hormuz approximately; no map shows military operations, flight paths, tanker positions or a navigation clearance. Scenario branches are conceptual and carry no probabilities.
▶ Explore the five scenes