Monday’s Markets: AI Pressure, Oil and a Split Trading Day
A dated look at Asian stocks, early European gains and AI-related pressure, with oil and the policy calendar in context. Reported 26 October 2026; not live prices.
▶ Explore the narrated graphic explainerKey takeaways
- European gains and Asian weakness can coexist within a mixed trading day.
- Index returns, individual stock moves and financing mechanisms answer different questions.
- Upcoming meetings and data releases are scheduled events, not known outcomes.
The dated facts and their scope
| Period or item | Reported fact or figure | Scope | Source |
|---|---|---|---|
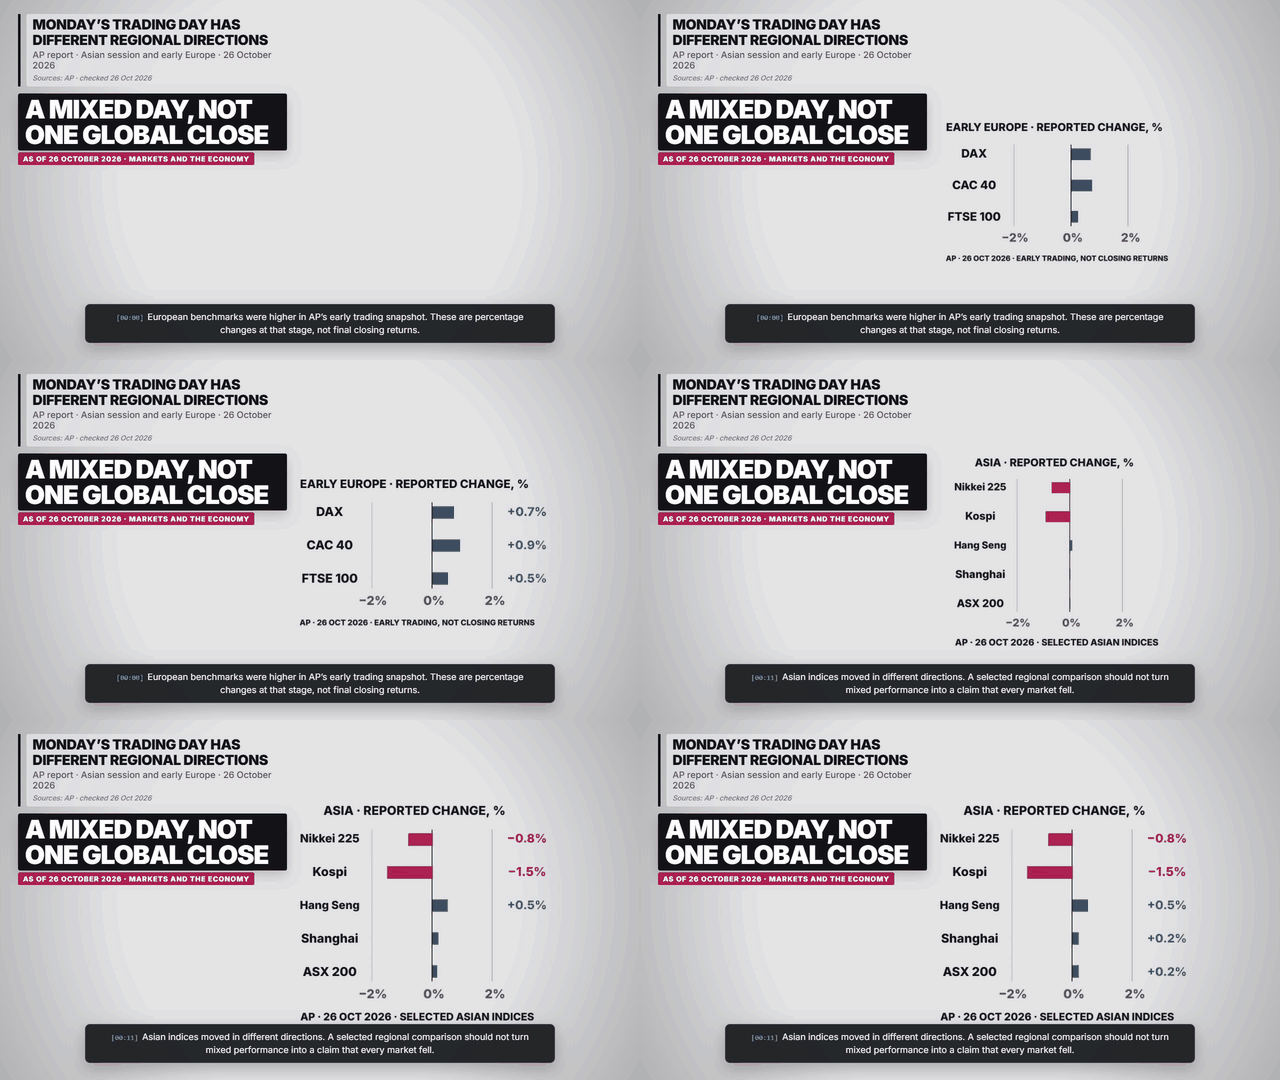
| Early Europe, 26 Oct | DAX +0.7%; CAC 40 +0.9%; FTSE 100 +0.5% | AP snapshot; not closing returns | AP: Monday’s global market report |
| Asia, 26 Oct | Nikkei −0.8%; Kospi −1.5%; Hang Seng +0.5%; Shanghai +0.2%; ASX +0.2% | Selected reported indices; same percentage unit | AP: Monday’s global market report |
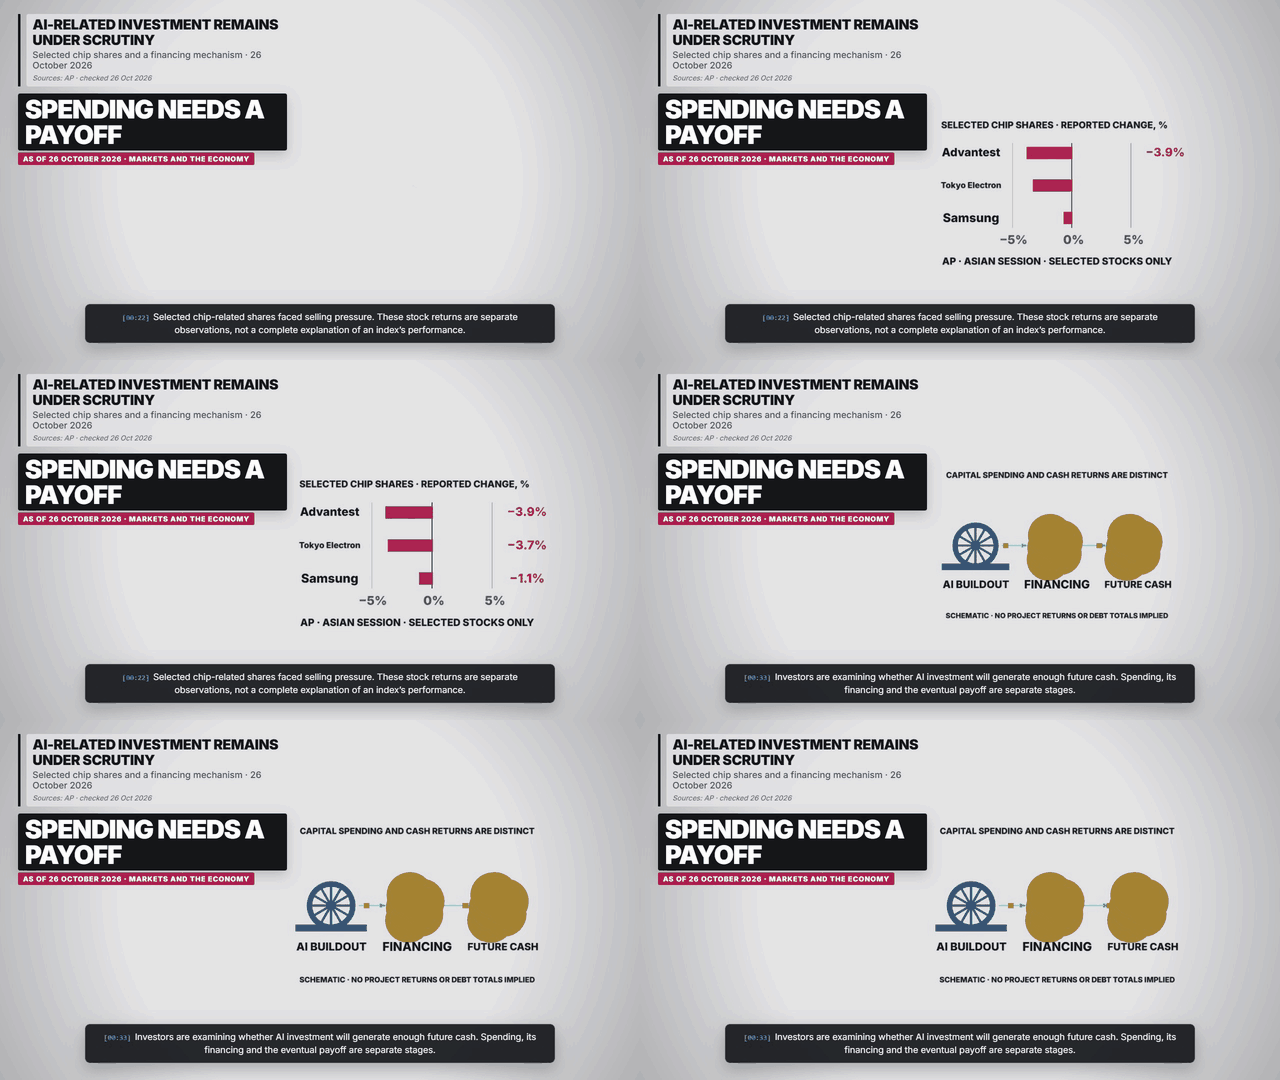
| Selected chip shares | Advantest −3.9%; Tokyo Electron −3.7%; Samsung −1.1% | Individual stocks; not an index decomposition | AP: Monday’s global market report |
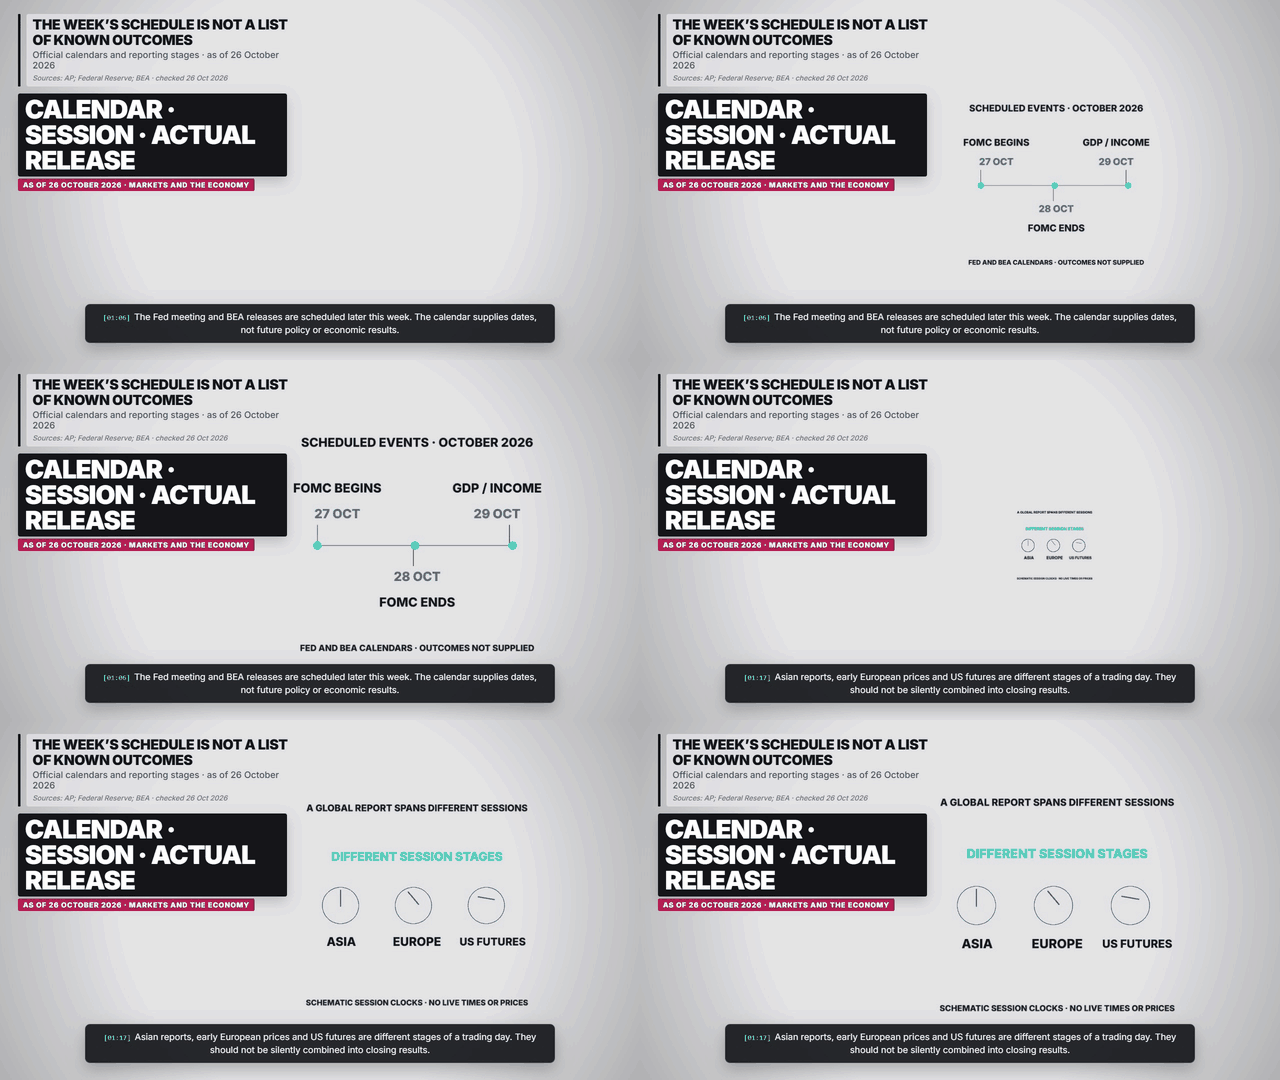
| 27–28 October | FOMC meeting | Scheduled; no rate decision forecast | Federal Reserve: FOMC calendar |
| 29 October | Q3 GDP; September Income and Outlays | Scheduled BEA releases; different reference periods | BEA: Release schedule |
Why does the headline describe a split day?
AP’s report combines an Asian-session account with early European readings. The two charts preserve those stages rather than creating a single global closing score. They use percentage changes, which can be compared as returns without comparing the raw levels of indices built on different bases. Source: AP: Monday’s global market report.
What do the chip-stock bars add?
The selected individual shares illustrate pressure within technology-linked trading. They are not a complete basket, a weighted contribution to an index or proof that every AI-related company moved the same way. A stock’s percentage move and an index’s percentage move are different series even when both use the same unit. Source: AP: Monday’s global market report.
Why discuss financing and future earnings?
The report describes concern over AI investment and borrowing. The flow diagram separates present capital spending, financing and eventual cash generation. It does not assume that every project is debt-funded or that promised revenue has already arrived. A useful follow-up would compare actual investment, liabilities and realized cash flow in company reports. Source: AP: Monday’s global market report.
How does the valuation illustration work?
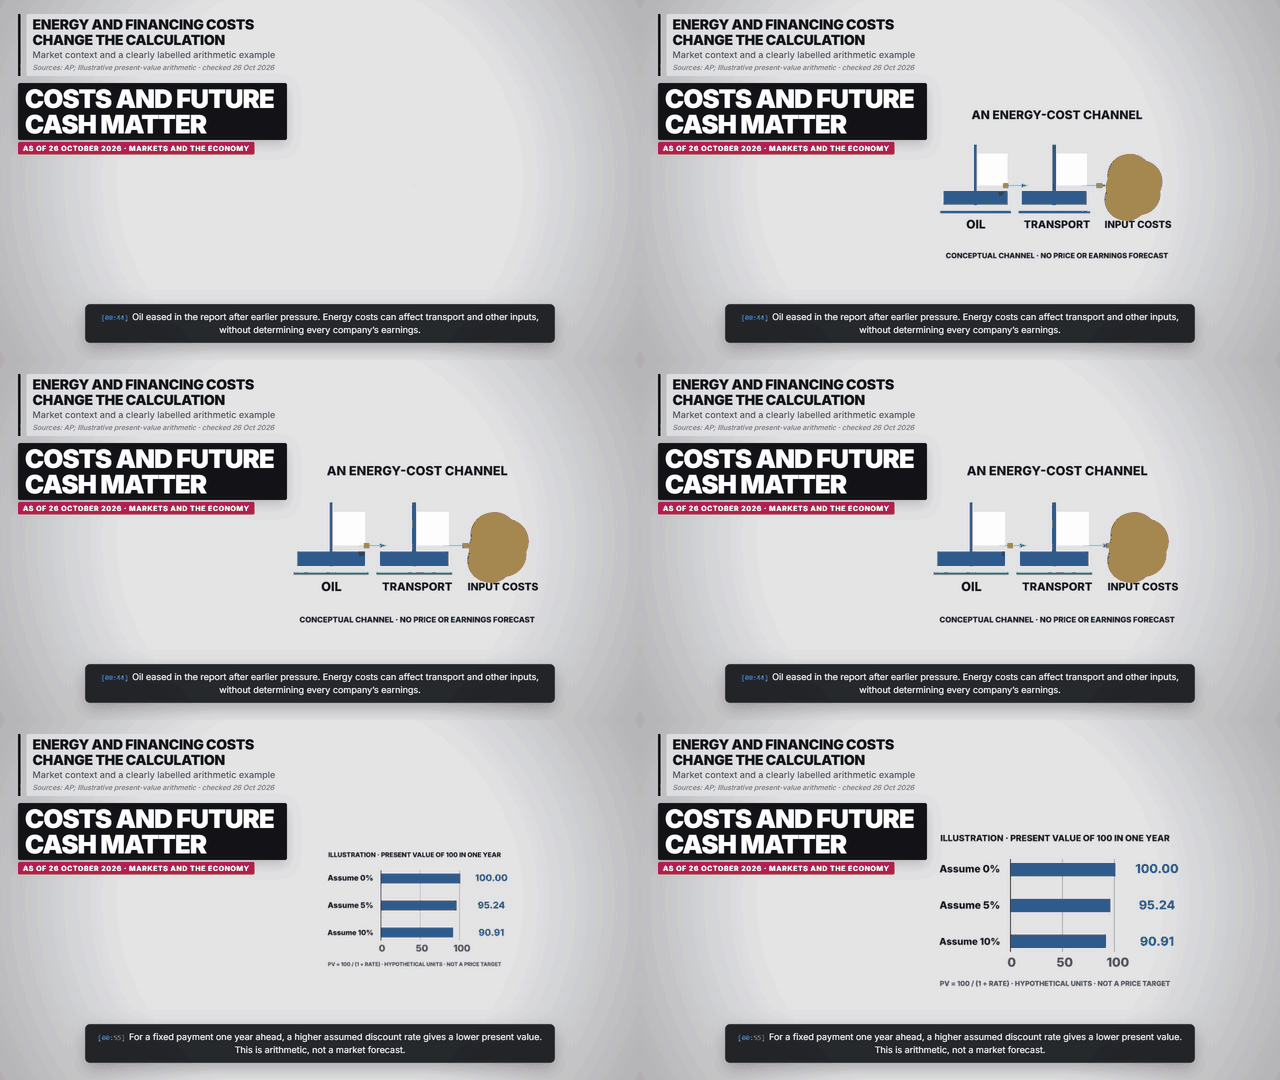
For one hypothetical payment of 100 units in one year, dividing by one plus an assumed rate gives its present value. The chart uses assumed rates of zero, five and ten percent, holding the payment and horizon fixed. It is arithmetic showing a sensitivity, not a forecast for interest rates, an AI stock or a portfolio. Source: Illustrative present-value arithmetic.
What is scheduled next?
The Fed calendar lists 27–28 October for the FOMC meeting. BEA lists 29 October for advance third-quarter GDP and September Personal Income and Outlays. Those are distinct meetings and releases. A calendar can establish timing while leaving policy decisions, economic values and subsequent market reactions unknown. Source: Federal Reserve: FOMC calendar.
How the graphics should be read
The charts and diagrams retain their dates, units and whether a figure is reported, estimated, projected or illustrative. Equal arrows do not encode quantities. Maps locate the subject and use generated country boundaries; they do not supply evidence about individual votes or live movements.
Frequently asked questions
Are these live prices?
No. The page preserves AP’s 26 October Asian-session and early-European snapshot.
Are all the charts closing returns?
No. Early European readings and Asian-session reports are labelled separately; they are not a synchronized global close.
Does the present-value chart predict rates?
No. It uses assumed rates solely to illustrate arithmetic for a hypothetical one-year payment.
Has the Fed’s October decision happened in this page?
No. The meeting remains scheduled for 27–28 October at the reporting cutoff.
Charts, maps and diagrams from the explainer
Sources and reporting scope
- AP: Monday’s global market report. 2026-10-26. Asian session and early European trading; not a synchronized global close. Selected index and chip-equipment stock percentage moves are reported snapshots.
- Federal Reserve: FOMC calendar. Checked 2026-10-26. The calendar lists the October meeting for 27–28 October. No future rate decision is supplied.
- BEA: Release schedule. Checked 2026-10-26. 29 October: advance Q3 GDP and September Personal Income and Outlays. Dates are scheduled, not released values.
- Illustrative present-value arithmetic. Illustration, 2026. A one-year hypothetical 100-unit payment has present value 100/(1+r). Rates 0%, 5% and 10% are teaching assumptions, not forecasts; the linked tool explains interest arithmetic, not a market valuation estimate.
Reported snapshot for 26 October 2026: Asian session readings and early European trading are kept separate. Percentage moves are not index-point levels or synchronized closing prices. The chart uses selected quoted indices and stocks; it does not represent every market. Oil context follows AP’s report without reproducing conflicting price-reference levels. The present-value illustration uses a hypothetical one-year 100-unit payment and assumed rates, not actual securities or a price target. Scheduled Fed and BEA events carry no predicted result. This is an explainer, not a live feed or investment recommendation.
▶ Explore the five scenesAlso consult the BEA release schedule for the dates and reference periods of its upcoming reports.