America’s Growth Puzzle: Strong Output, Costly Living
US third-quarter 2026 GDP growth and September inflation explained: stronger output, persistent prices and the household spending squeeze. Checked 30 October 2026.
Explore the five-scene explainerKey takeaways
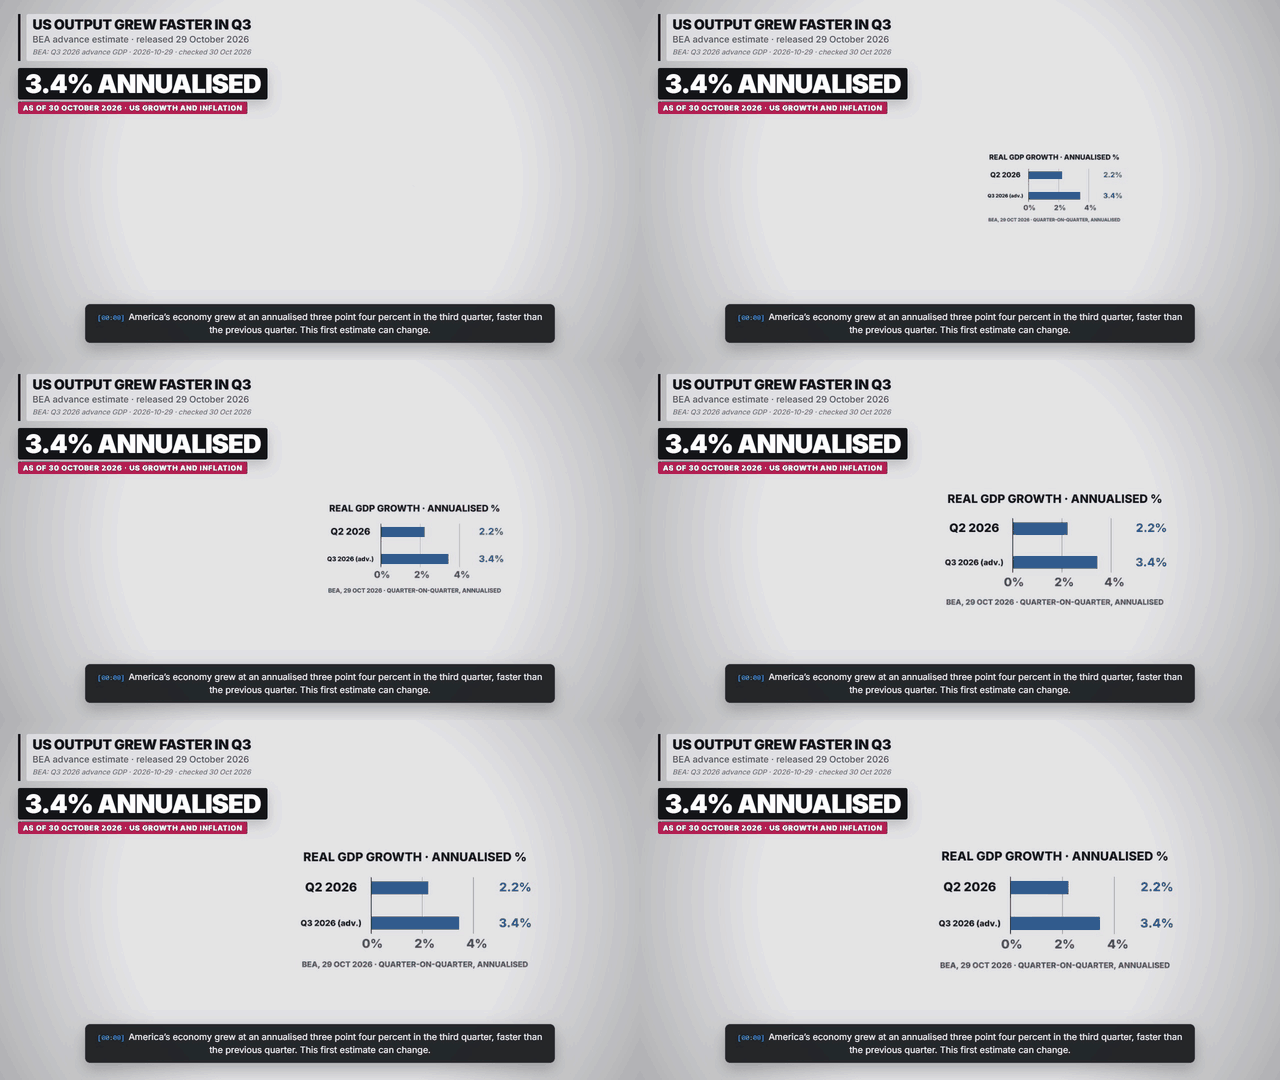
- The Q3 advance estimate puts real GDP growth at 3.4% annualised, after 2.2% in Q2.
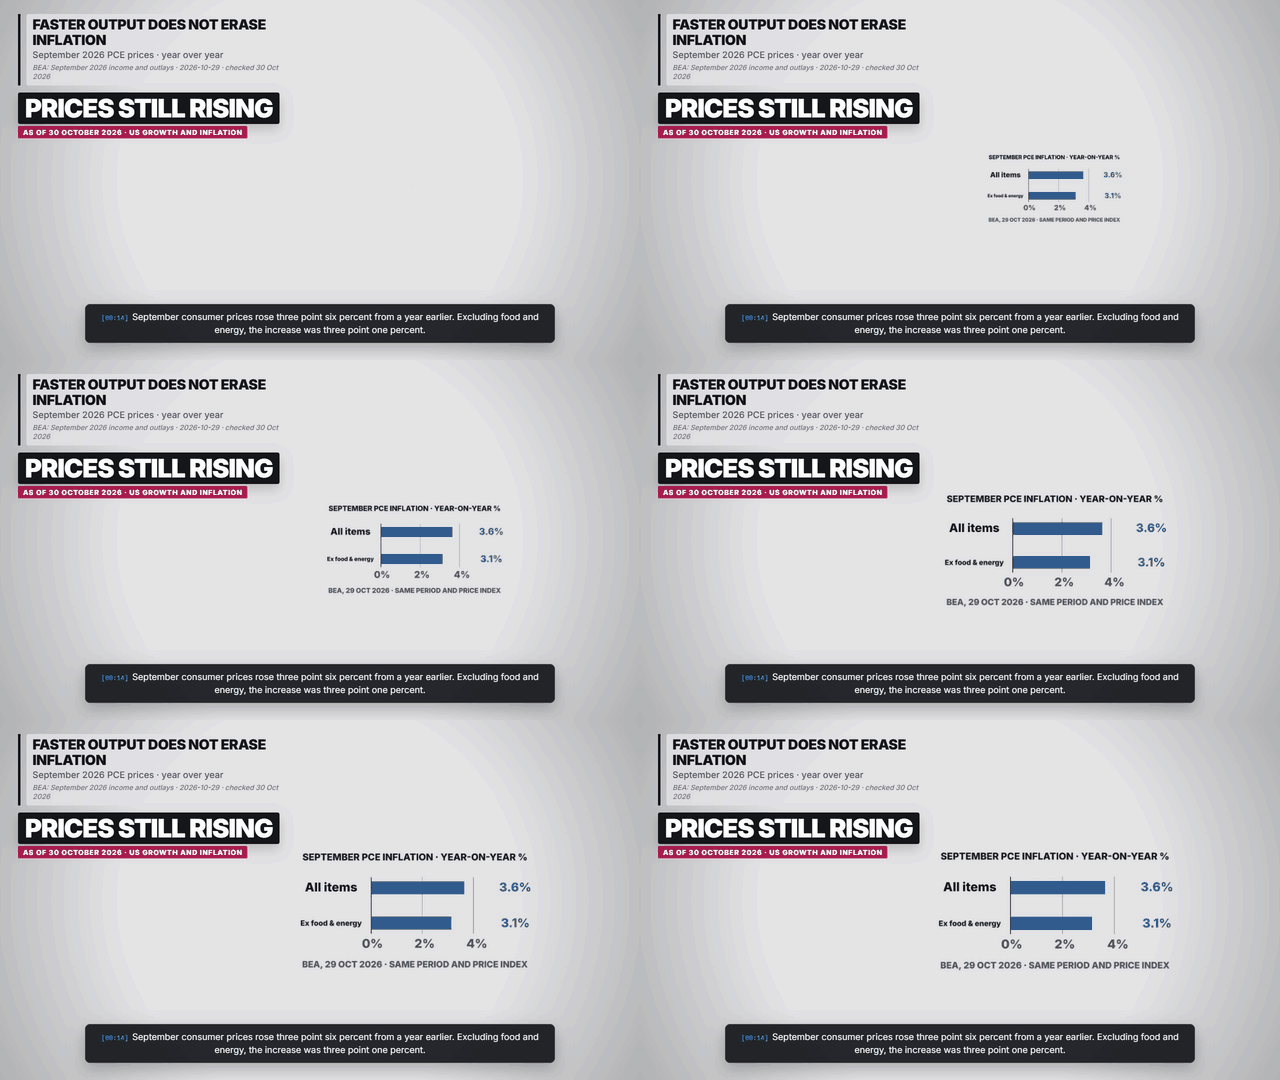
- September PCE prices rose 3.6% year over year; the measure excluding food and energy rose 3.1%.
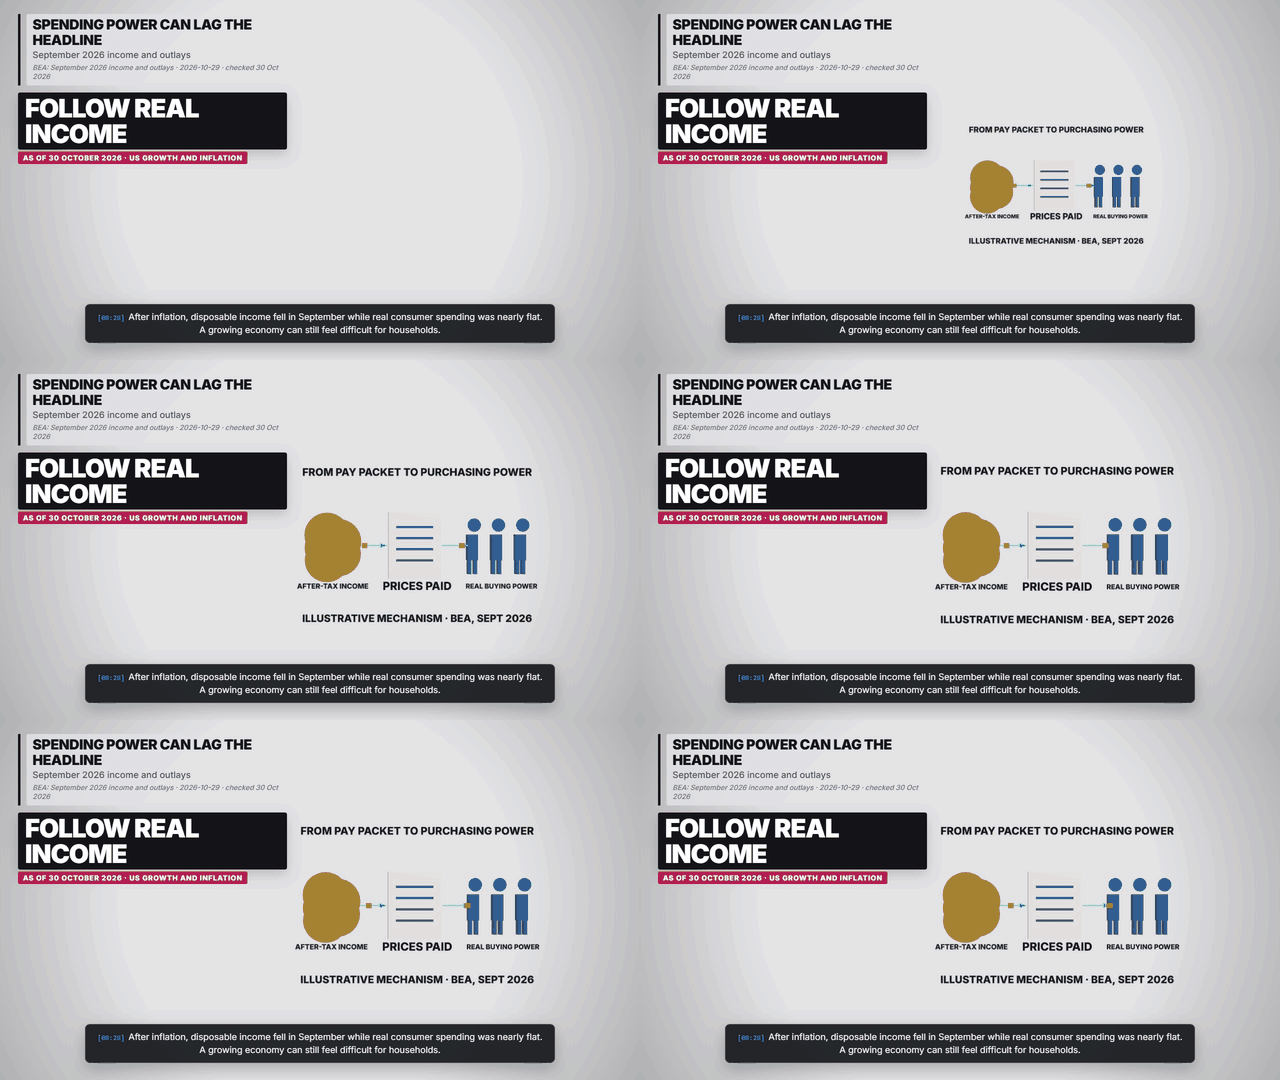
- September real disposable income fell 0.3% month over month, while real spending was almost unchanged.
Sourced figures and status
| Period | Figure or status | Source |
|---|---|---|
| Q2 → Q3 2026 | Real GDP growth: 2.2% → 3.4%, quarter-on-quarter annualised; Q3 is an advance estimate. | BEA: Q3 2026 advance GDP |
| September 2026 | PCE inflation: 3.6% year over year; excluding food and energy: 3.1%. | BEA: September 2026 income and outlays |
| September 2026 | Real disposable income: −0.3% month over month. Real PCE increased less than 0.1%. | BEA: September 2026 income and outlays |
What the growth figure tells us
GDP measures inflation-adjusted production across the economy. Annualising expresses the quarter’s pace as if it continued for a year. It does not mean output expanded by 3.4% during those three months. Investment, consumption and government spending supported the rise; exports declined. Source and definitions.
Why households may feel a different economy
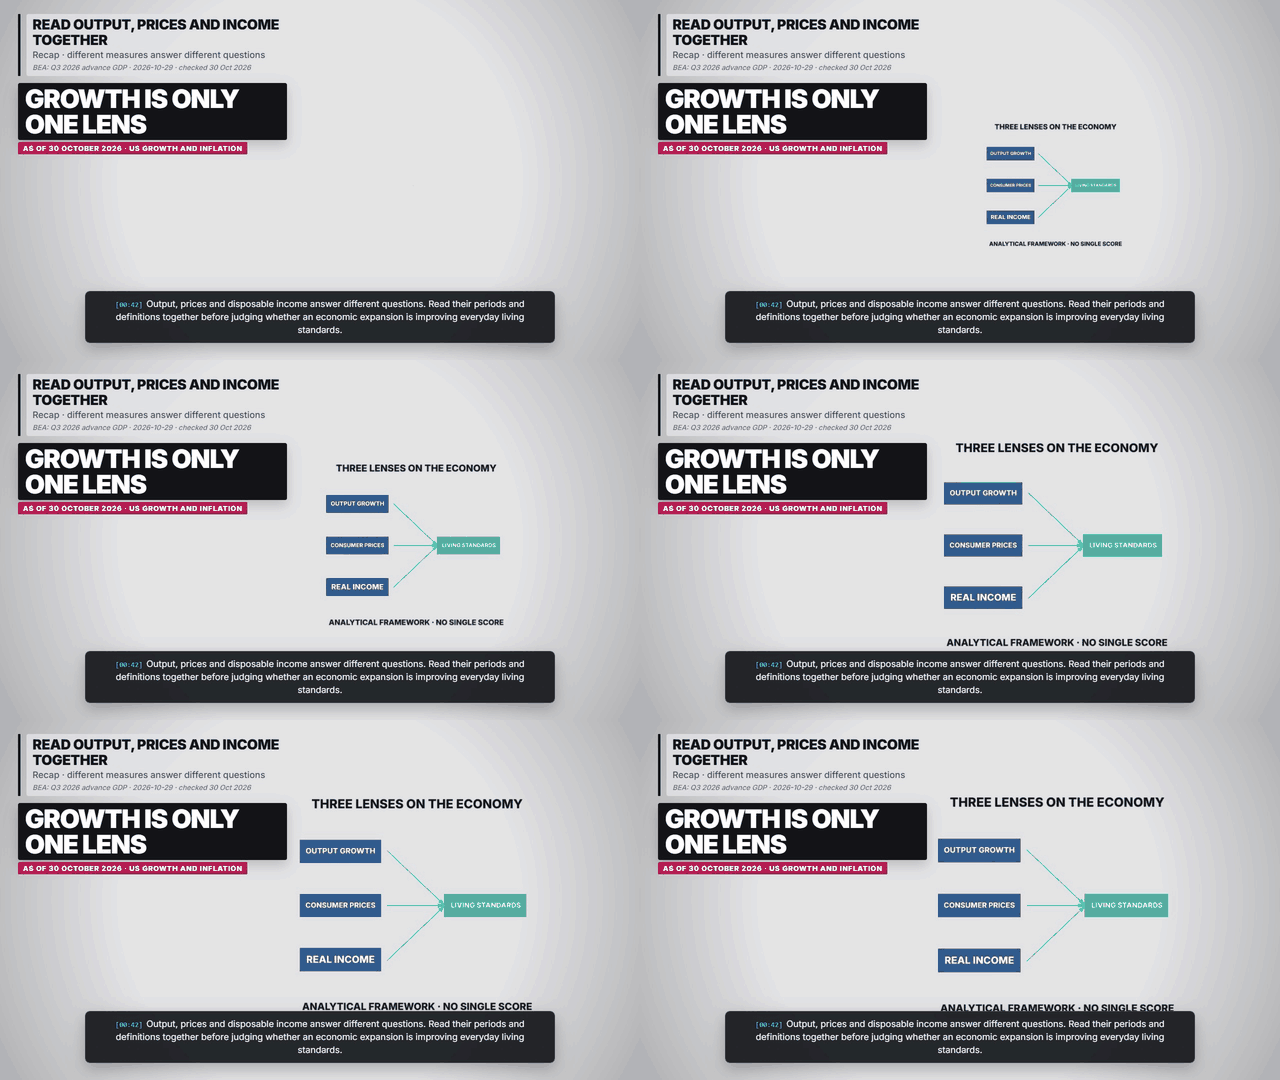
A growth release measures production, while a household budget depends on income after tax and the prices it pays. The September data show a small fall in real disposable income and almost no increase in real spending. These measures help explain why headline growth cannot settle the question of financial comfort. Source and definitions.
How to read the two releases
Keep the time windows separate. The GDP comparison is between quarters and annualised; the inflation comparison is with September a year earlier. Subtracting the inflation rate from real GDP growth would both mix periods and adjust an already inflation-adjusted measure twice. Source and definitions.
Charts, maps and diagrams from the explainer
Frequently asked questions
Did US output grow 3.4% during the quarter?
No. The 3.4% figure is an annualised quarterly growth rate, not the unannualised change during July–September.
Does slower inflation mean prices are falling?
No. Positive inflation means the price index is rising. A lower positive rate means prices rise more slowly.
Are these final GDP figures?
No. The 29 October release is the advance estimate and can be revised.
Sources and reporting scope
BEA: Q3 2026 advance GDP. 2026-10-29. Real GDP growth is quarter-on-quarter at an annualised rate. The advance estimate is subject to revision.
BEA: September 2026 income and outlays. 2026-10-29. PCE inflation is year over year unless marked monthly. Real disposable income is inflation adjusted.
As of 30 October 2026. GDP describes July–September output; the income and price release describes September. Annualised quarterly GDP growth and year-over-year inflation have different periods and must not be subtracted. Diagrams show mechanisms, not measured contributions. Advance estimates may be revised. Re-check before re-rendering.