Wall Street, 2 November: Dow Up, Tech Down, Midterms Ahead
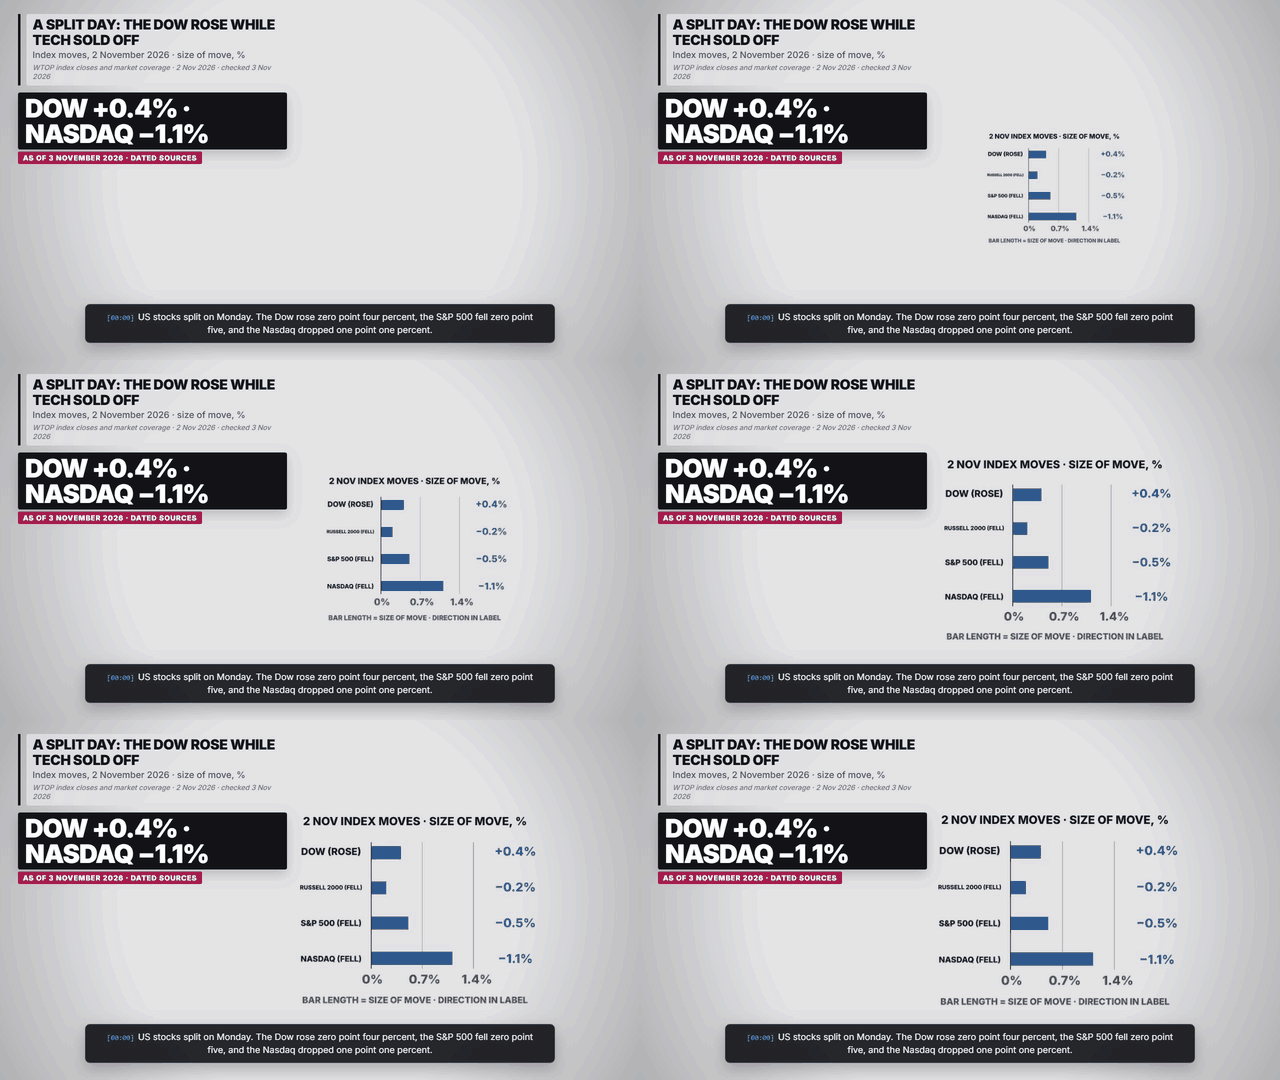
US stocks on 2 November 2026: the Dow rose 0.4% while the S&P 500 fell 0.5% and the Nasdaq 1.1% as oil dropped and AI stocks stayed shaky before the midterms.
Explore the five-scene explainerKey takeaways
- The Dow rose 0.4% to 51,983.98, while the S&P 500 fell 0.5% to 7,541.40 and the Nasdaq fell 1.1% to 25,164.32.
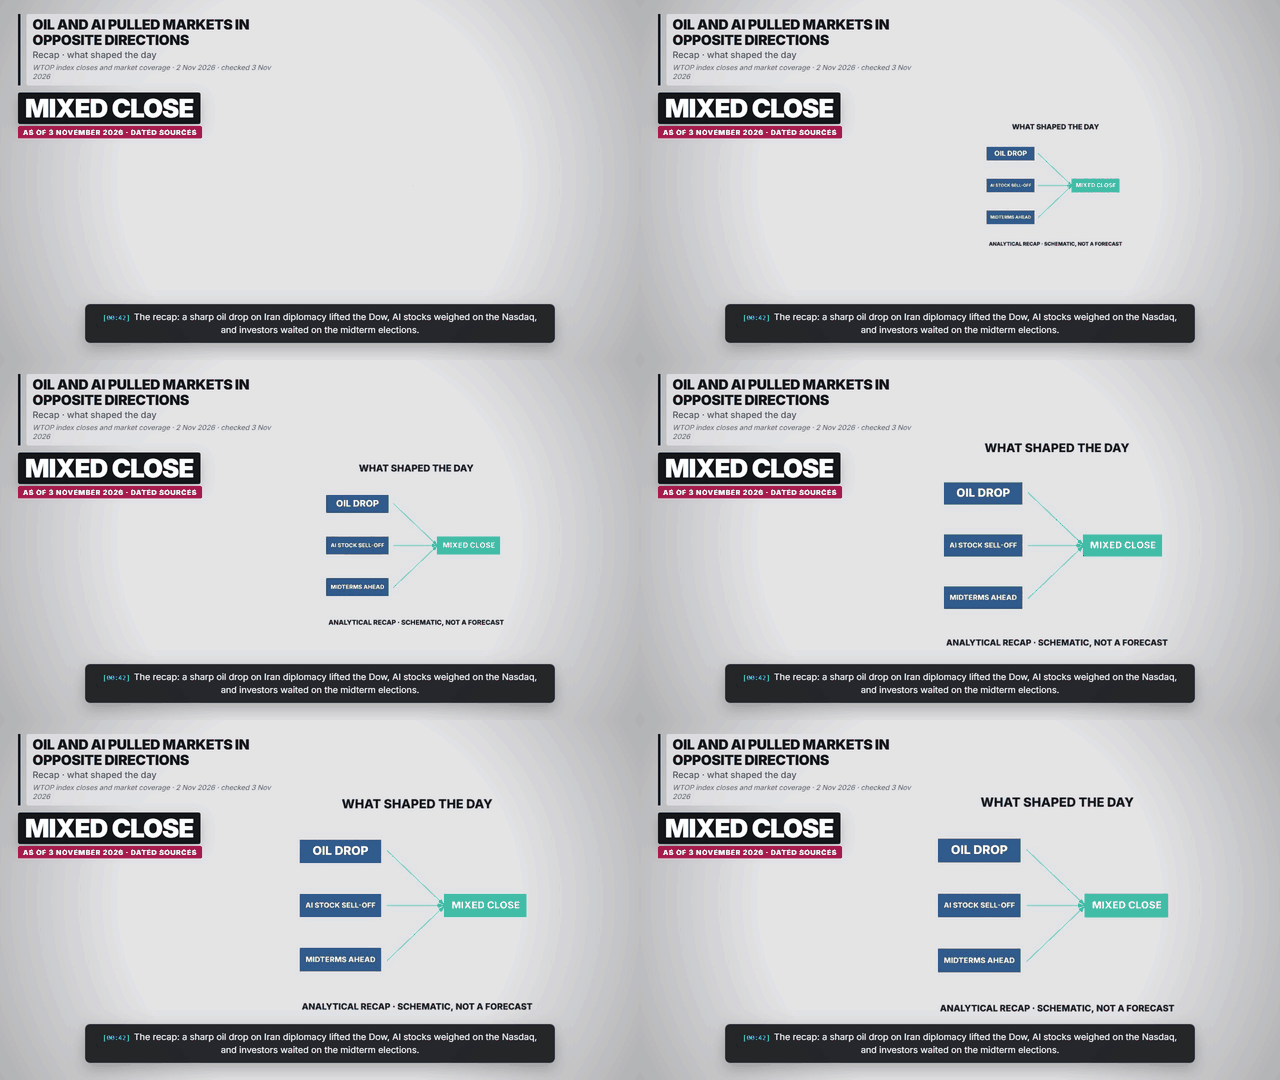
- Oil posted its sharpest drop in three months on US–Iran diplomacy hopes, helping the Dow, while AI stocks weighed on the Nasdaq.
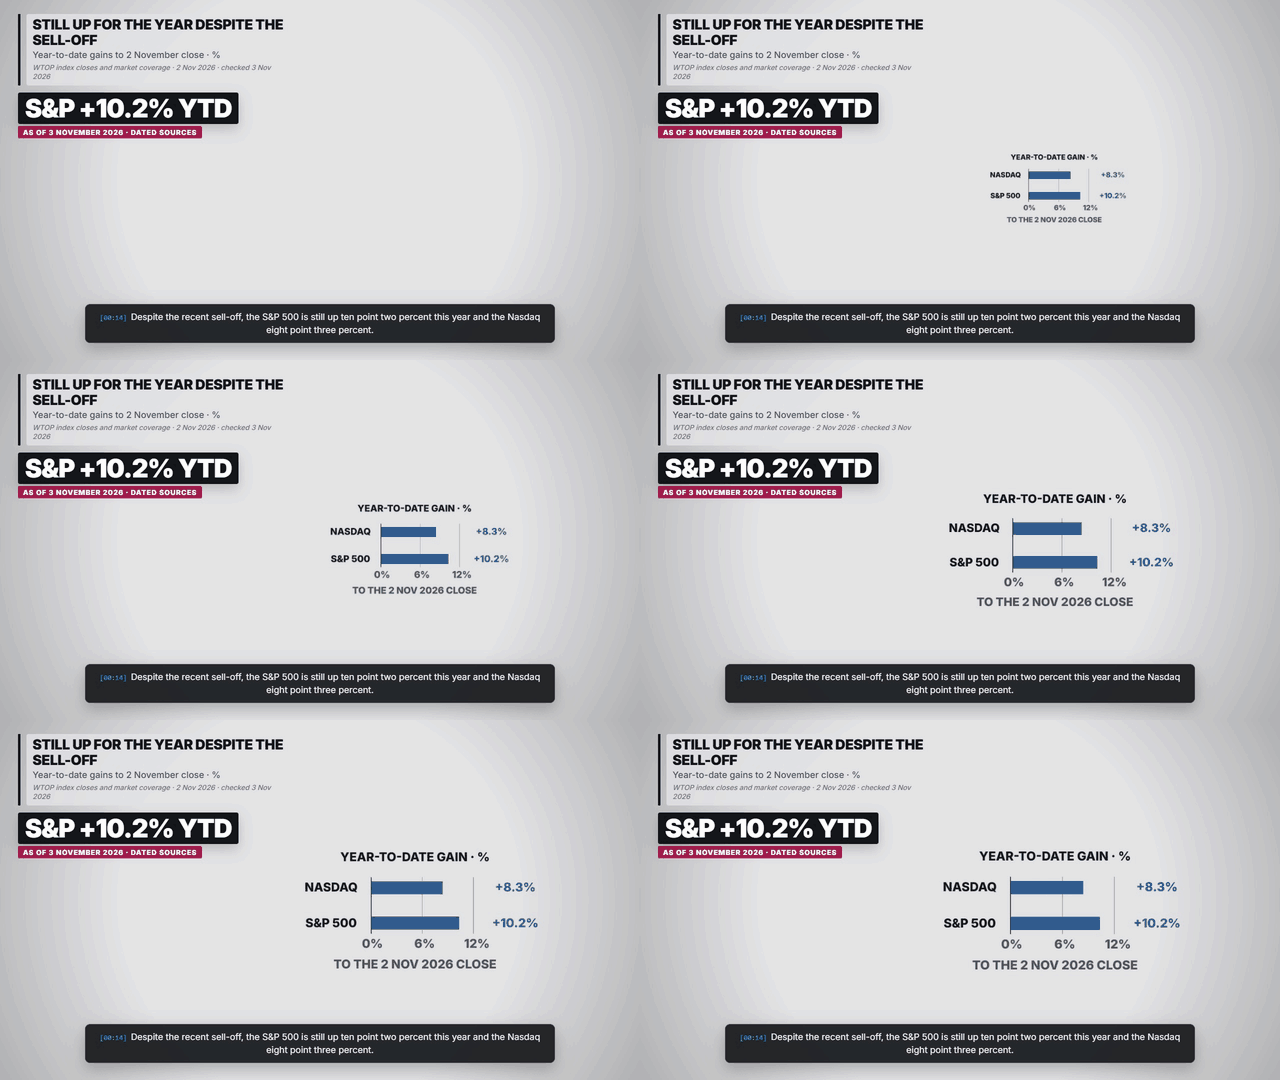
- Year to date the S&P 500 is up 10.2% and the Nasdaq up 8.3%.
Sourced figures and status
| Period | Figure or status | Source |
|---|---|---|
| 2 Nov 2026 | S&P 500: −0.5% to 7,541.40. | How major US stock indexes fared Monday 11/2/2026 (WTOP) · 2026-11-02 |
| 2 Nov 2026 | Nasdaq Composite: −1.1% to 25,164.32. | How major US stock indexes fared Monday 11/2/2026 (WTOP) · 2026-11-02 |
| 2 Nov 2026 | Dow Jones Industrial Average: +0.4% to 51,983.98; Russell 2000: −0.2% to 2,805.88. | How major US stock indexes fared Monday 11/2/2026 (WTOP) · 2026-11-02 |
| Year to date | S&P 500 +10.2%; Nasdaq +8.3%. | How major US stock indexes fared Monday 11/2/2026 (WTOP) · 2026-11-02 |
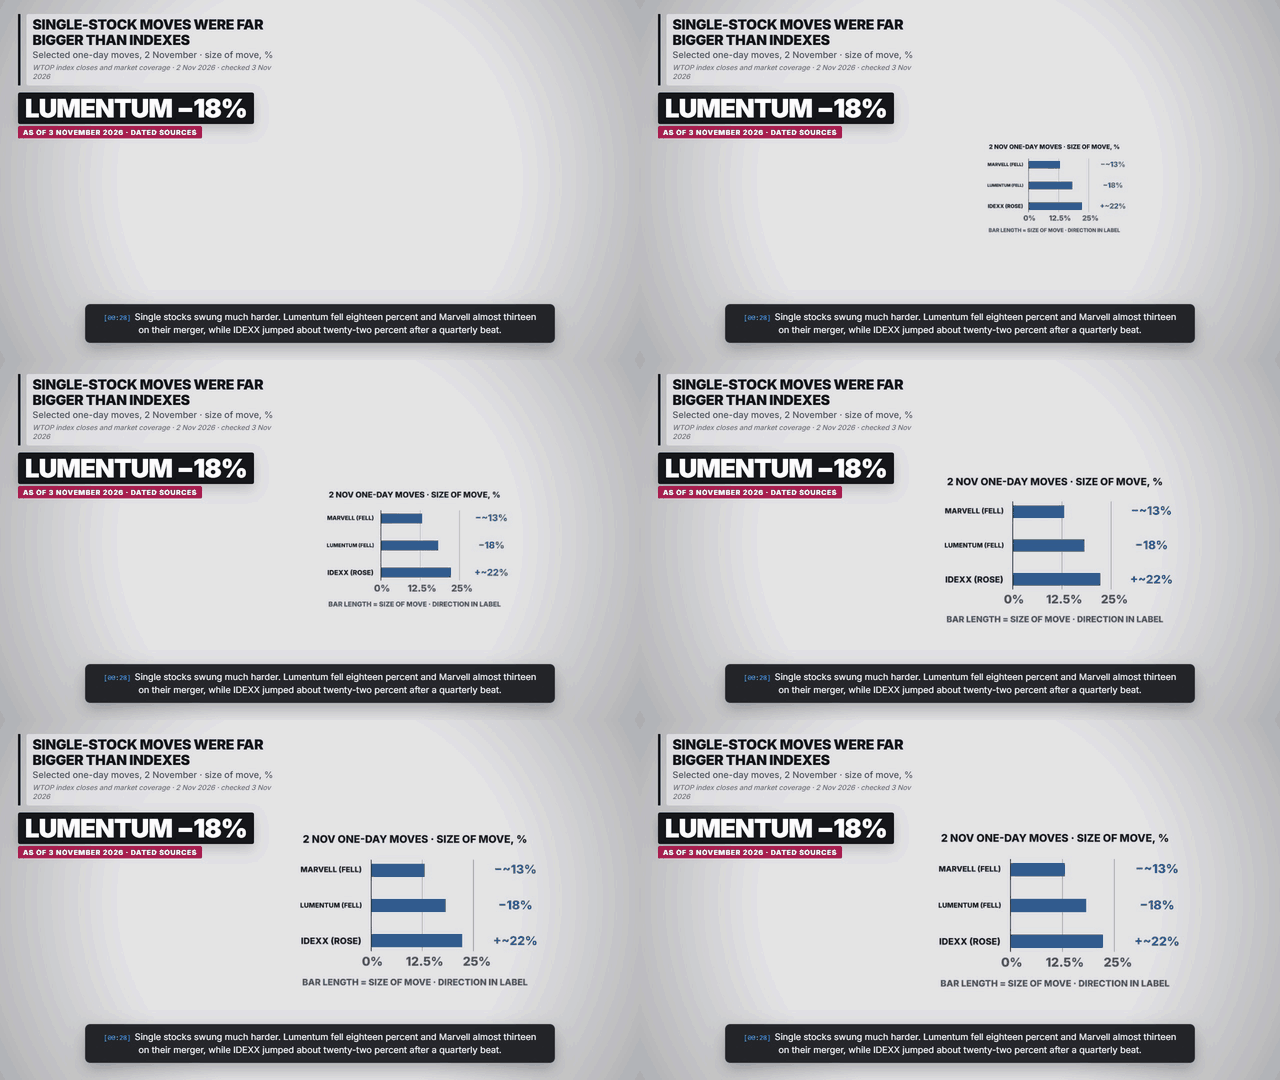
| 2 Nov 2026 | Single stocks: Marvell down almost 13%, Lumentum down 18%, IDEXX up about 22%. | Stock market today, Monday 2 November (Yahoo Finance) · 2026-11-02 |
Why did the Dow rise while the Nasdaq fell?
Coverage links the Dow’s gain to the drop in oil on US–Iran diplomacy hopes, and the Nasdaq’s fall to a continued sell-off in tech and AI stocks. Nearly seven in ten S&P 500 stocks still advanced. Source and qualifications.
What about the midterms?
Voters went to the polls on 3 November. Coverage cited the elections as a source of caution; this page reports no election result. Source and qualifications.
Charts, maps and diagrams from the explainer
Frequently asked questions
Did the stock market rise or fall on 2 November 2026?
It was mixed: the Dow rose 0.4% while the S&P 500 fell 0.5% and the Nasdaq fell 1.1%.
What moved markets?
Coverage cited a sharp oil drop on US–Iran diplomacy hopes, the continuing AI sell-off and the upcoming midterm elections.
Are these closing figures?
Yes. Intraday figures differed between outlets, so closing levels are used.
Sources and reporting scope
How major US stock indexes fared Monday 11/2/2026 (WTOP). 2026-11-02. Closing levels and percentage changes for the S&P 500, Nasdaq Composite, Dow and Russell 2000 on 2 November 2026.
Stock market today, Monday 2 November (Yahoo Finance). 2026-11-02. Market coverage of the drivers: oil drop on US–Iran diplomacy hopes, the AI-stock sell-off, single-stock moves and the midterm elections on 3 November. Intraday figures differ between outlets; closes are used.
Checked 3 November 2026. All moves are for the trading day of Monday 2 November 2026 and use closing levels; intraday figures differ between outlets. Year-to-date figures are to the 2 November close. Single-stock moves are one-day reactions. The US midterm elections on 3 November are context only; no result is reported here.