China: Factories Slip Back Below the PMI Threshold
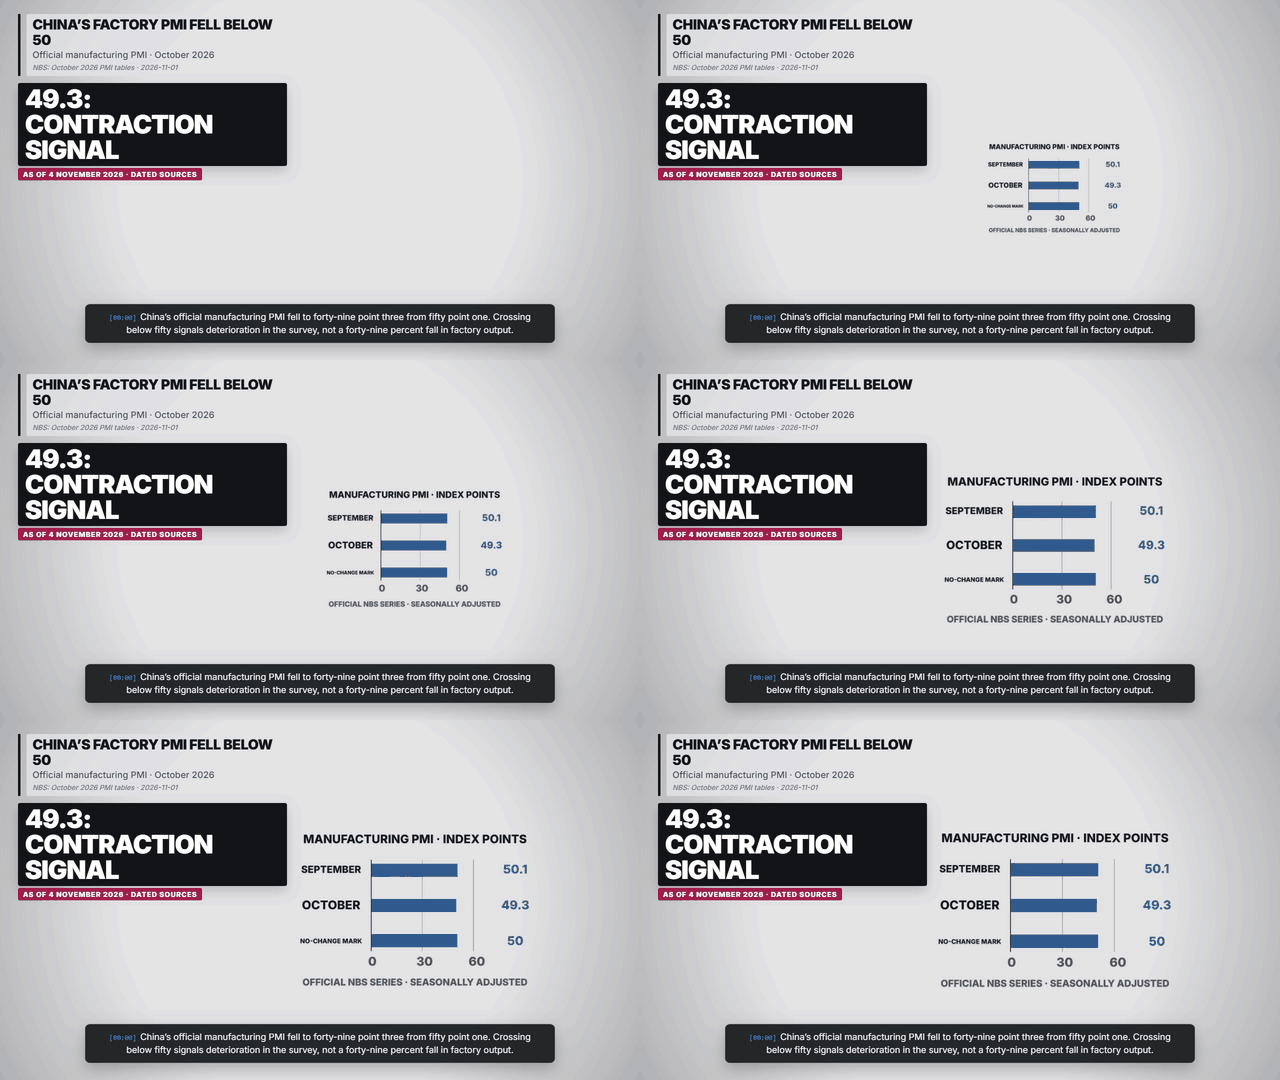
China’s official manufacturing PMI fell to 49.3 in October 2026 from 50.1. Production and export-order readings explain the renewed weakness.
Explore the five-scene explainerKey takeaways
- The official manufacturing reading crossed below 50.
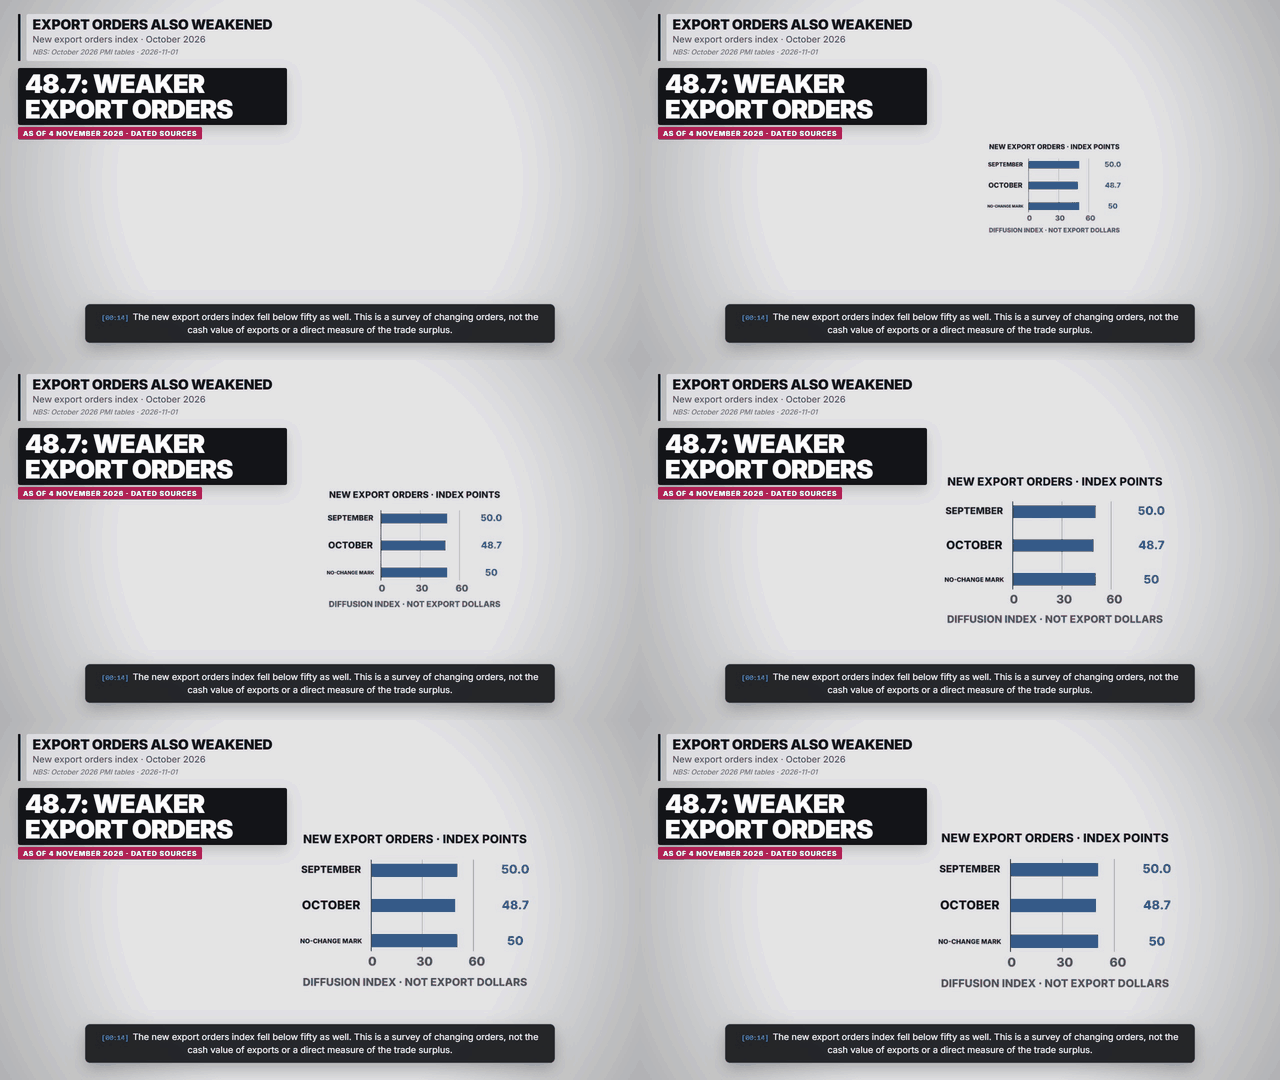
- New export orders weakened, but the index is not a dollar-export total.
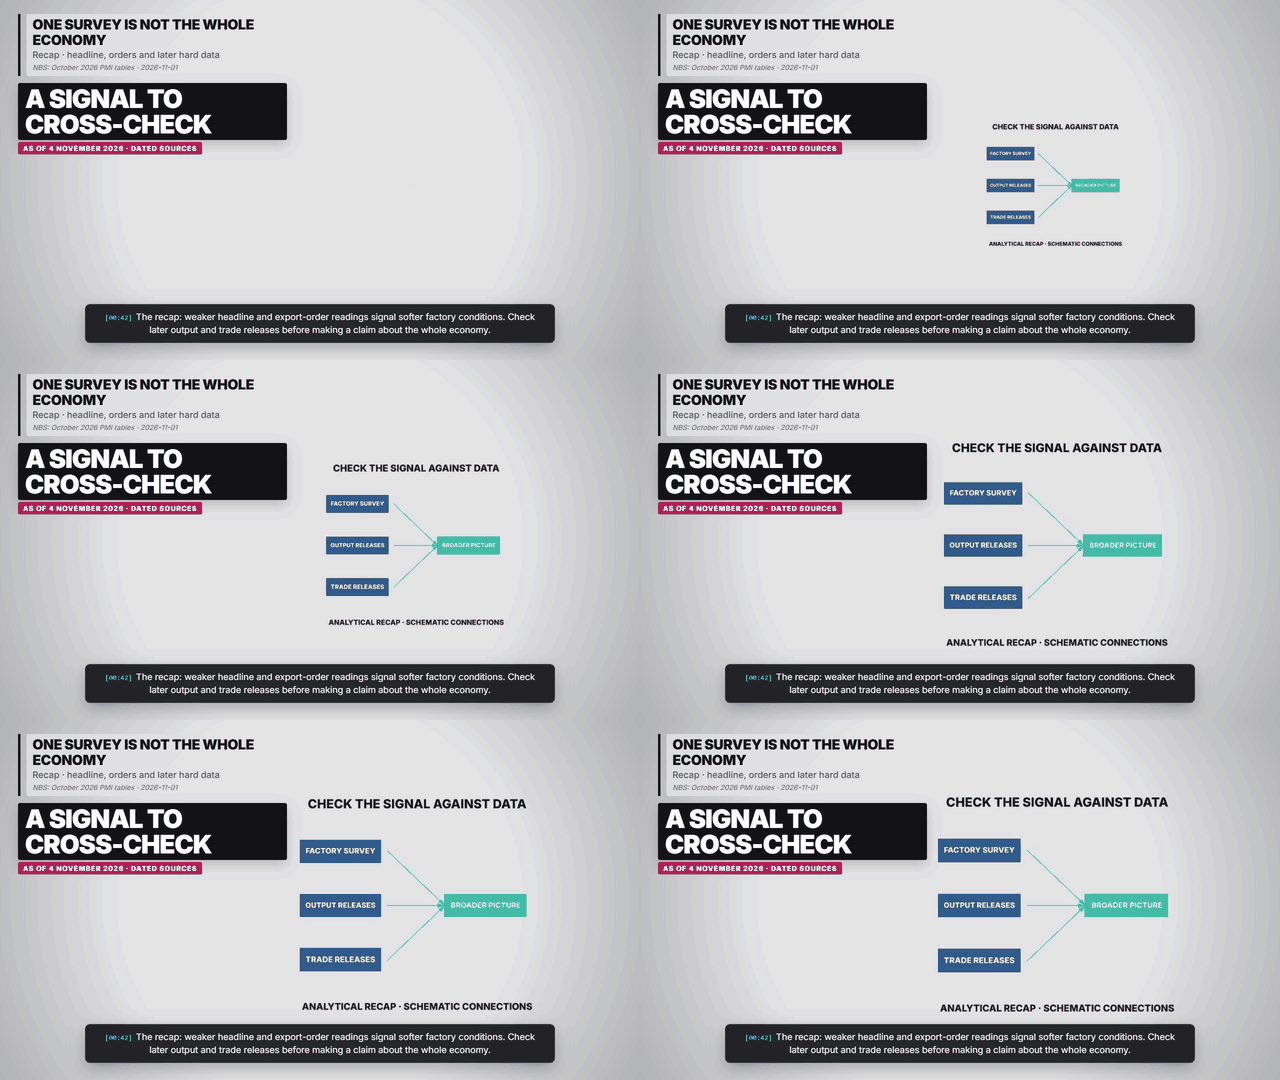
- Survey signals should be checked against subsequent output and trade data.
Sourced figures and status
| Period | Figure or status | Source |
|---|---|---|
| Sept / Oct 2026 manufacturing | 50.1 / 49.3 index points, seasonally adjusted. | NBS: October 2026 PMI tables · 2026-11-01 |
| Sept / Oct 2026 new export orders | 50.0 / 48.7 index points; no-change threshold 50. | NBS: October 2026 PMI tables · 2026-11-01 |
| Publication dates | AP reports the original 31 Oct release; the NBS English page displays 1 Nov. | AP: China factory contraction · 2026-10-31 |
What does crossing 50 tell us?
The index summarises the balance of survey responses. The threshold separates improving from deteriorating conditions relative to the previous month. A small move across it changes the direction signal, but does not quantify the percentage change in physical production. Source and context.
Why keep orders and exports separate?
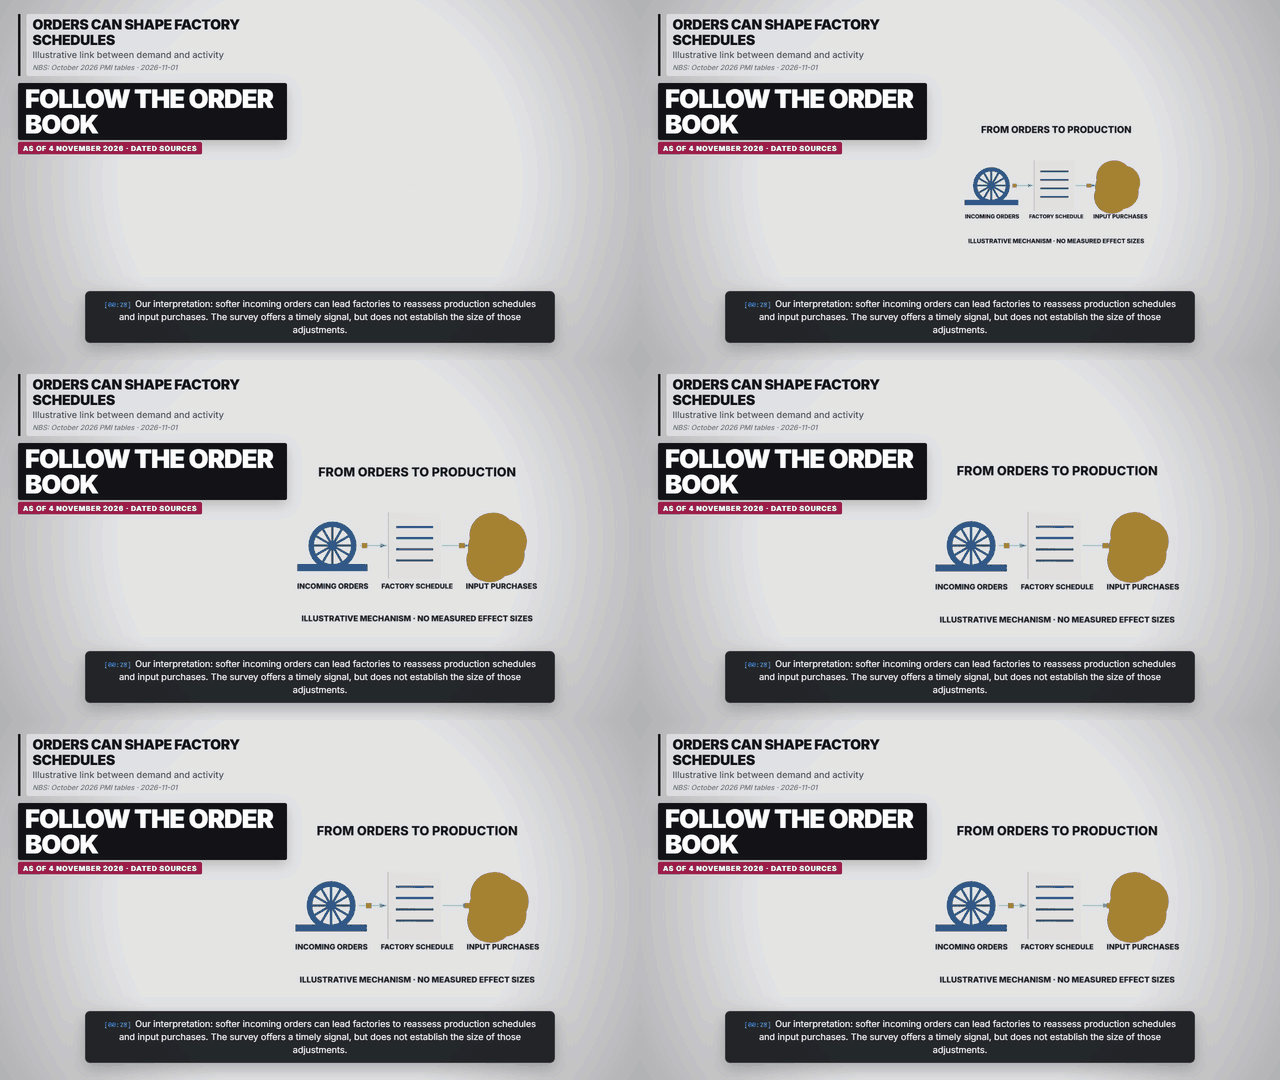
Orders are part of the pipeline; shipments and recorded trade values occur at another stage. Our diagram traces that relationship without assuming an order becomes a shipment in the same month. That is why the survey alone cannot establish a new trade-surplus figure. Source and context.
Charts, maps and diagrams from the explainer
Frequently asked questions
Does 49.3 mean output fell by 0.7%?
No. The distance below 50 is not a production-growth percentage.
Why are two publication dates mentioned?
AP dates the original release to 31 October, while the NBS English page visibly displays 1 November. Both refer to October survey conditions.
Sources and reporting scope
NBS: October 2026 PMI tables. 2026-11-01. English page visibly dated 1 November; URL contains 3 November. October survey indexes are seasonally adjusted; index points are not output-growth percentages.
AP: China factory contraction. 2026-10-31. AP reports the original Saturday release on 31 October; distinguish that release from the English-page date.
As of 4 November 2026. October survey results were reported by AP on 31 October; the NBS English page displays 1 November despite its URL containing 3 November. Official seasonally adjusted PMI is 49.3 versus 50.1 in September. PMI is a diffusion index, not a percentage change in output. Export-order readings measure survey direction, not dollar exports. Re-check before re-rendering.