CHINA’S FACTORY PMI FELL BELOW 50

Official manufacturing PMI · October 2026

49.3: CONTRACTION SIGNAL
AS OF 4 NOVEMBER 2026 · DATED SOURCES
Transcript

Full transcript

The narration below matches the explainer. Its original reporting dates and qualifications still apply.

Read the companion article

CHINA’S FACTORY PMI FELL BELOW 50

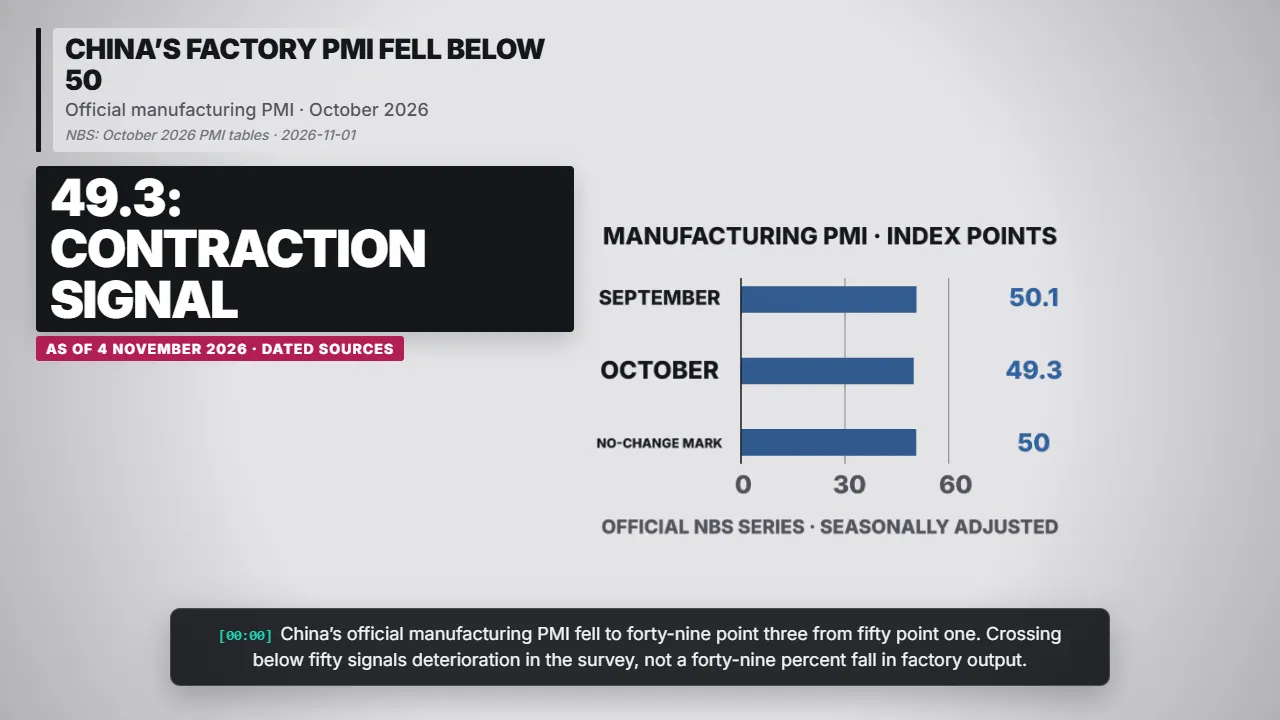
Bar chart: China’s factory PMI fell below 50 — 49.3: Contraction signal. China’s official manufacturing PMI fell to forty-nine point three from fifty point one.
China’s factory PMI fell below 50 — 49.3: Contraction signal NBS: October 2026 PMI tables · 2026-11-01

China’s official manufacturing PMI fell to forty-nine point three from fifty point one. Crossing below fifty signals deterioration in the survey, not a forty-nine percent fall in factory output.

NBS: October 2026 PMI tables · 2026-11-01

EXPORT ORDERS ALSO WEAKENED
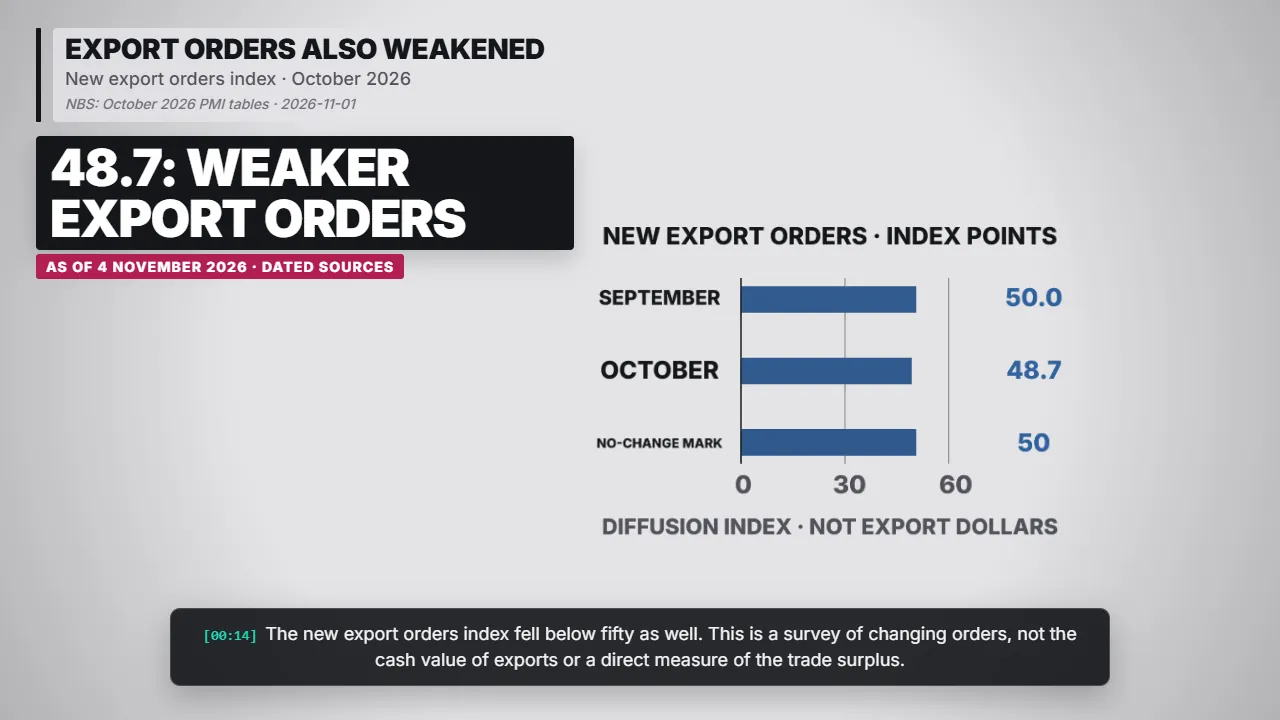
Bar chart: Export orders also weakened — 48.7: Weaker export orders. The new export orders index fell below fifty as well.
Export orders also weakened — 48.7: Weaker export orders NBS: October 2026 PMI tables · 2026-11-01

The new export orders index fell below fifty as well. This is a survey of changing orders, not the cash value of exports or a direct measure of the trade surplus.

NBS: October 2026 PMI tables · 2026-11-01

ORDERS CAN SHAPE FACTORY SCHEDULES
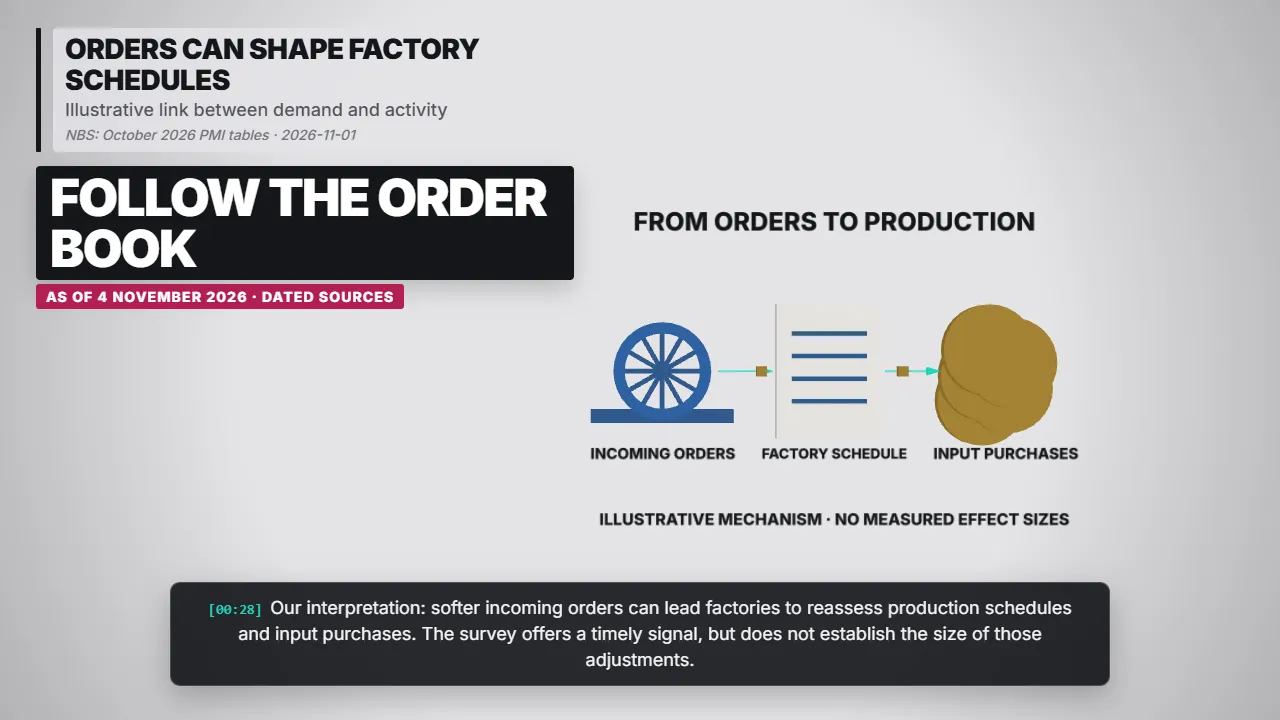
Flow diagram: Orders can shape factory schedules — Follow the order book. Our interpretation: softer incoming orders can lead factories to reassess production schedules and input purchases.
Orders can shape factory schedules — Follow the order book NBS: October 2026 PMI tables · 2026-11-01

Our interpretation: softer incoming orders can lead factories to reassess production schedules and input purchases. The survey offers a timely signal, but does not establish the size of those adjustments.

NBS: October 2026 PMI tables · 2026-11-01

ONE SURVEY IS NOT THE WHOLE ECONOMY
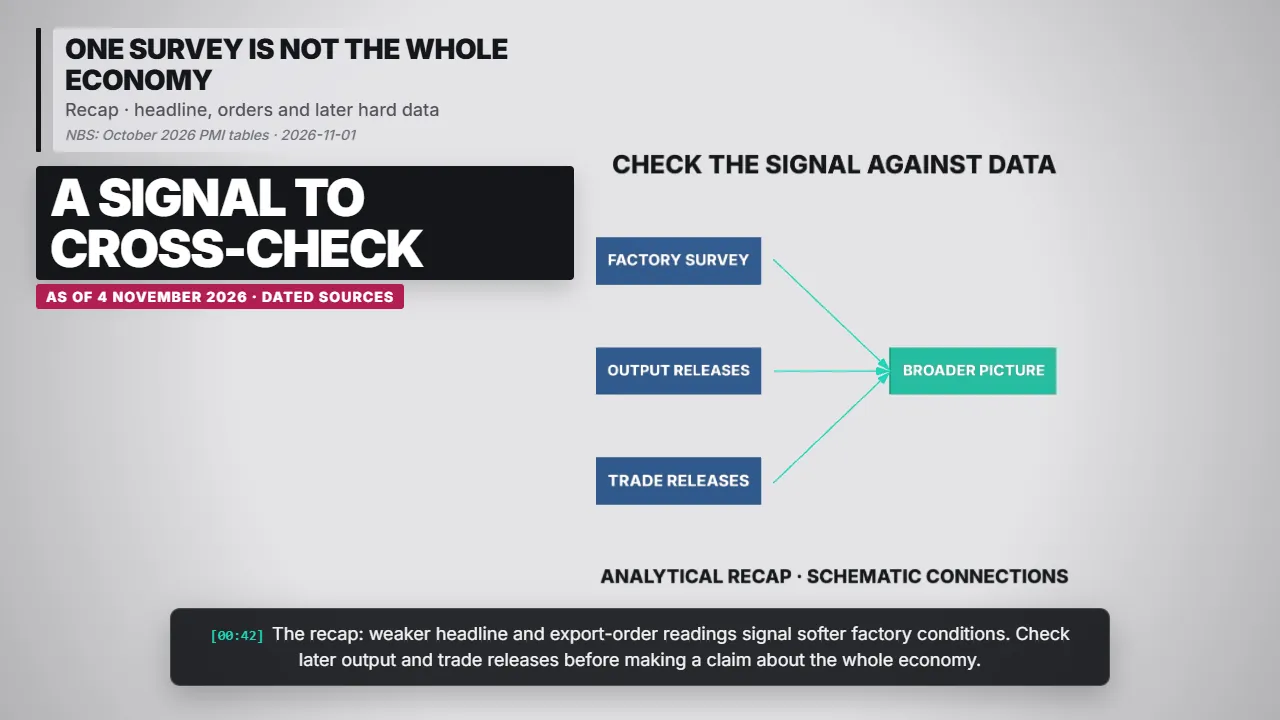
Network diagram: One survey is not the whole economy — A signal to cross-check. The recap: weaker headline and export-order readings signal softer factory conditions.
One survey is not the whole economy — A signal to cross-check NBS: October 2026 PMI tables · 2026-11-01

The recap: weaker headline and export-order readings signal softer factory conditions. Check later output and trade releases before making a claim about the whole economy.

NBS: October 2026 PMI tables · 2026-11-01

SOURCES AND QUALIFICATIONS

The National Bureau of Statistics supplies the survey tables. AP dates the original release. The English page’s publication date differs; all charts refer to October conditions.

NBS: October 2026 PMI tables · 2026-11-01

Source links

All Explainers
[00:00]
Read the full article

China: Factories Slip Back Below the PMI Threshold

As of 4 November 2026. October survey results were reported by AP on 31 October; the NBS English page displays 1 November despite its URL containing 3 November. Official seasonally adjusted PMI is 49.3 versus 50.1 in September. PMI is a diffusion index, not a percentage change in output. Export-order readings measure survey direction, not dollar exports. Re-check before re-rendering.

NBS: October 2026 PMI tables. 2026-11-01. English page visibly dated 1 November; URL contains 3 November. October survey indexes are seasonally adjusted; index points are not output-growth percentages.

AP: China factory contraction. 2026-10-31. AP reports the original Saturday release on 31 October; distinguish that release from the English-page date.