The Commodity Shock: World Bank Forecasts a 23% Rise
The World Bank’s October 2026 commodity outlook explained: projected 2026 price rises, energy exposure and why commodity inflation is not consumer inflation.
Explore the five-scene explainerKey takeaways
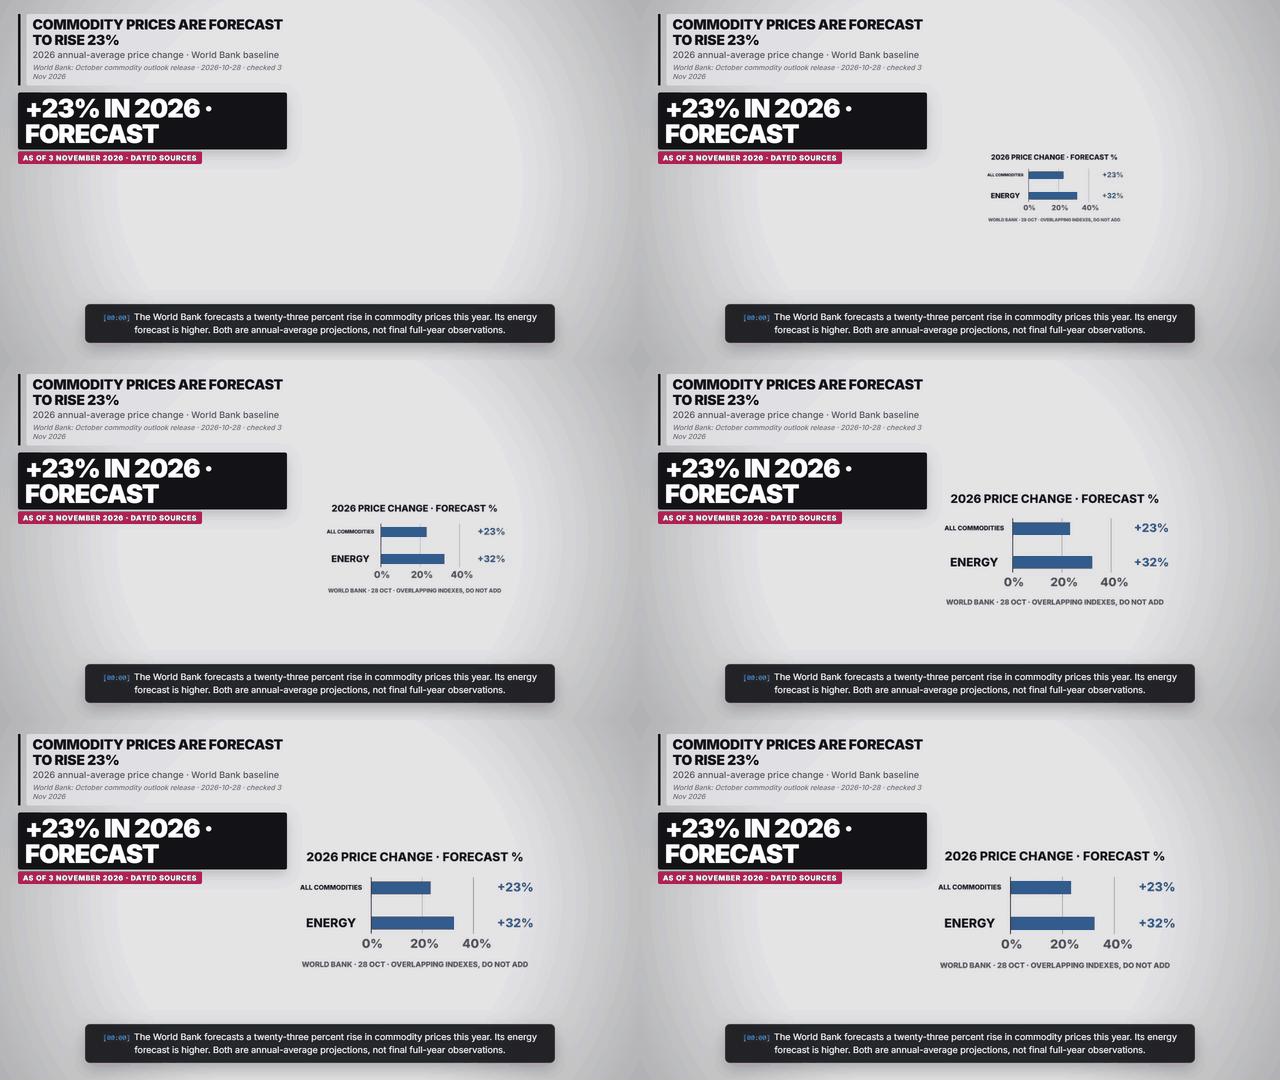
- The World Bank projects all-commodity prices up 23% and energy prices up 32% in 2026.
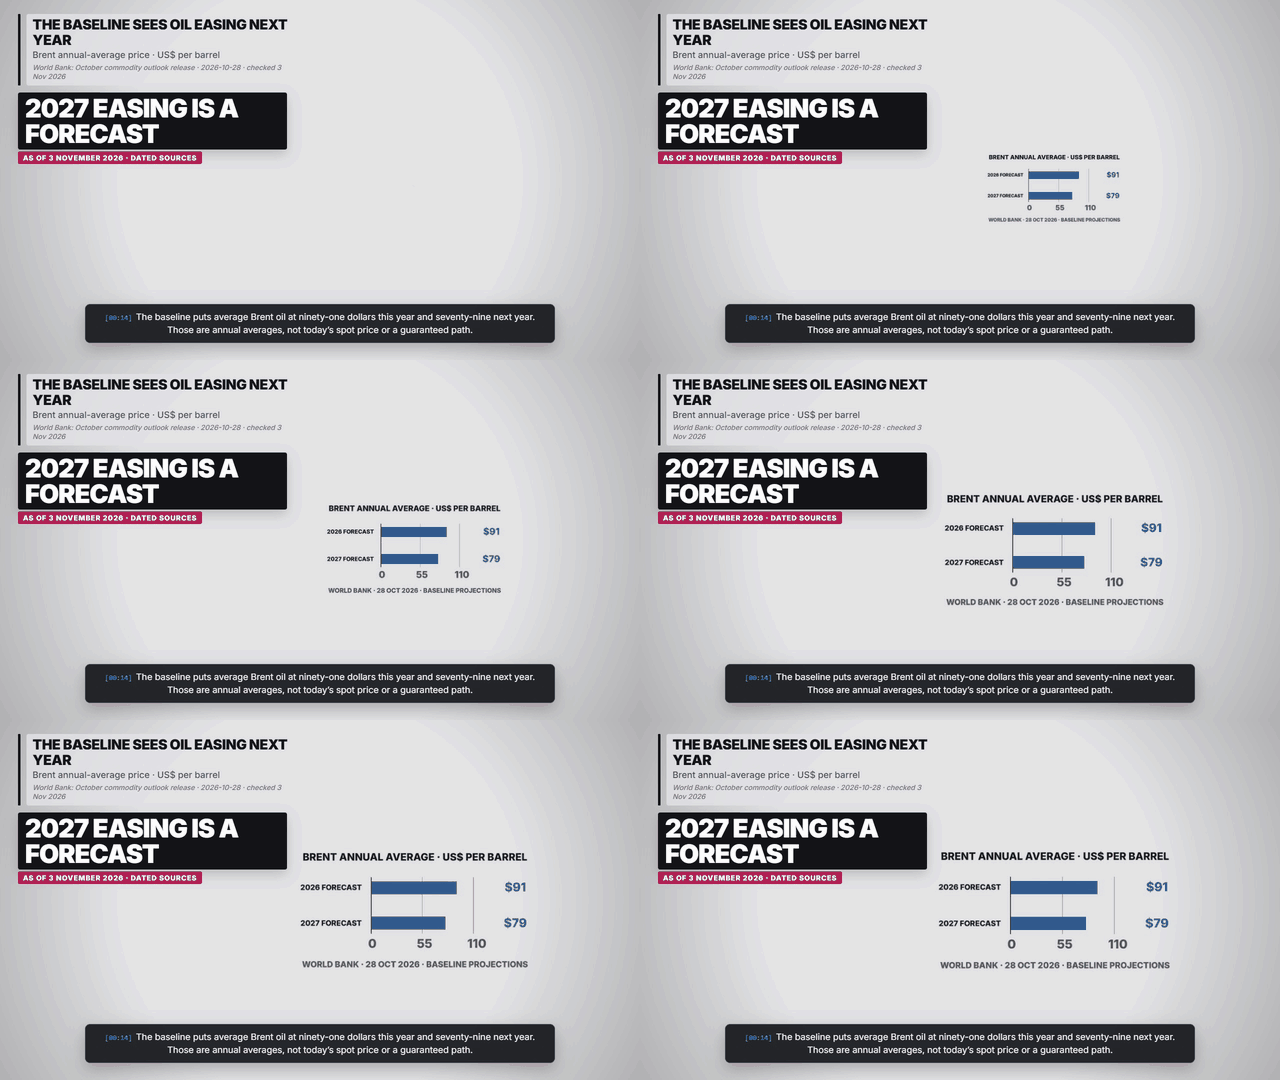
- Its baseline Brent averages are $91 in 2026 and $79 in 2027.
- The projections depend on supply assumptions and are not consumer-price inflation rates.
Sourced figures and status
| Period | Figure or status | Source |
|---|---|---|
| 2026 annual average, forecast | All commodities +23%; energy +32% versus 2025. Indexes overlap. | World Bank: October commodity outlook release · 2026-10-28 |
| Annual average, baseline forecast | Brent: $91 per barrel in 2026; $79 in 2027. | World Bank: October commodity outlook release · 2026-10-28 |
Why can an input-price shock spread?
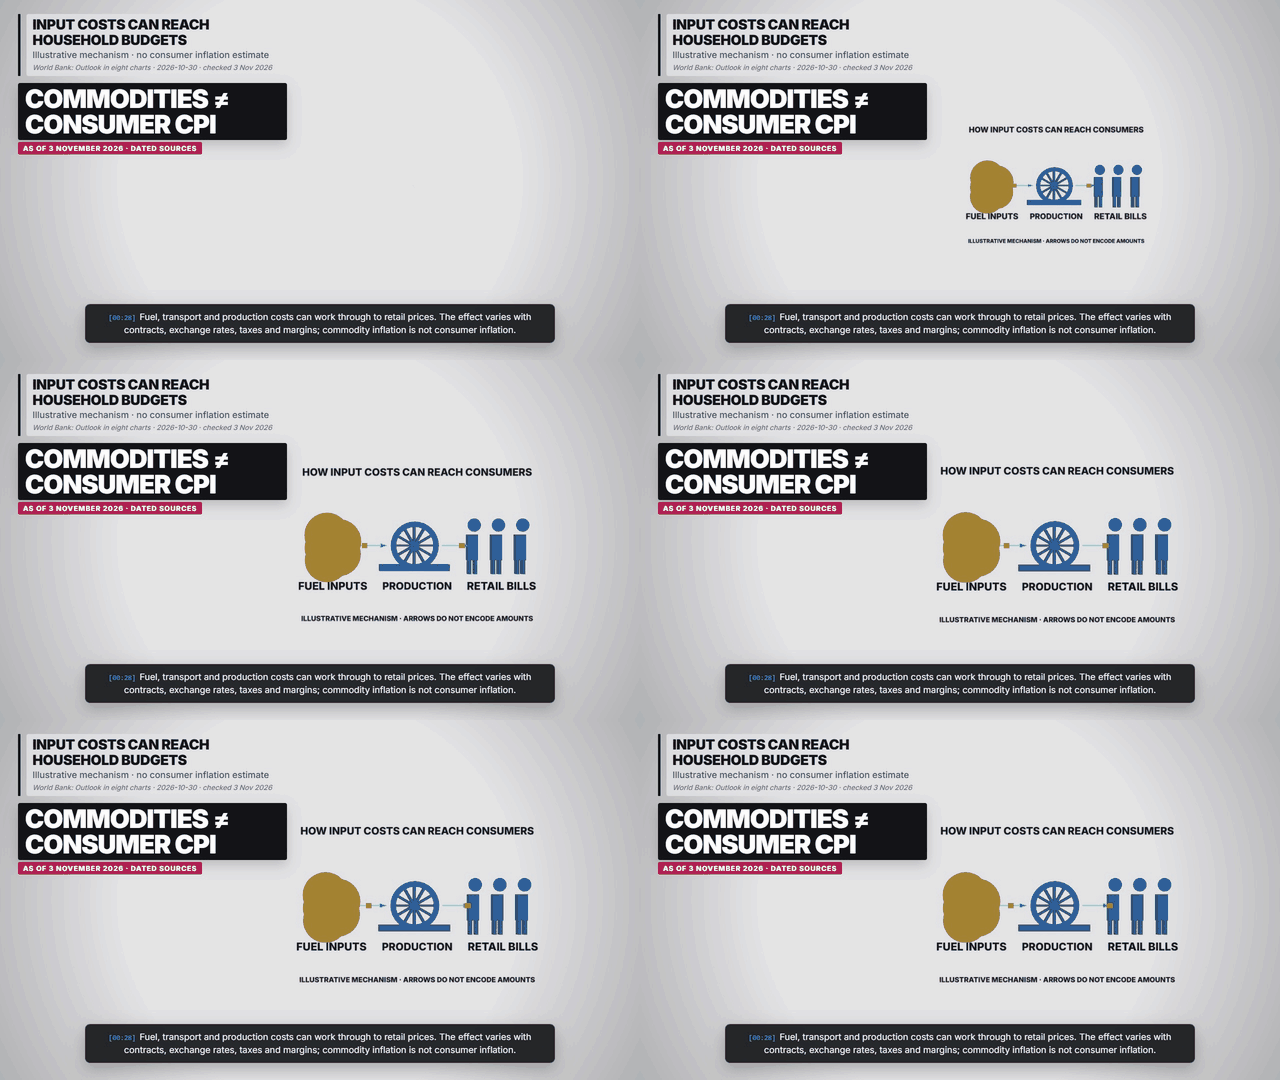
Our interpretation is that cost exposure connects production stages: transport, manufacturing and retailing all buy inputs. Contracts and margins can delay or absorb the shock. A commodity index therefore identifies pressure without establishing a one-for-one rise in household living costs. Source and qualifications.
What would change this outlook?
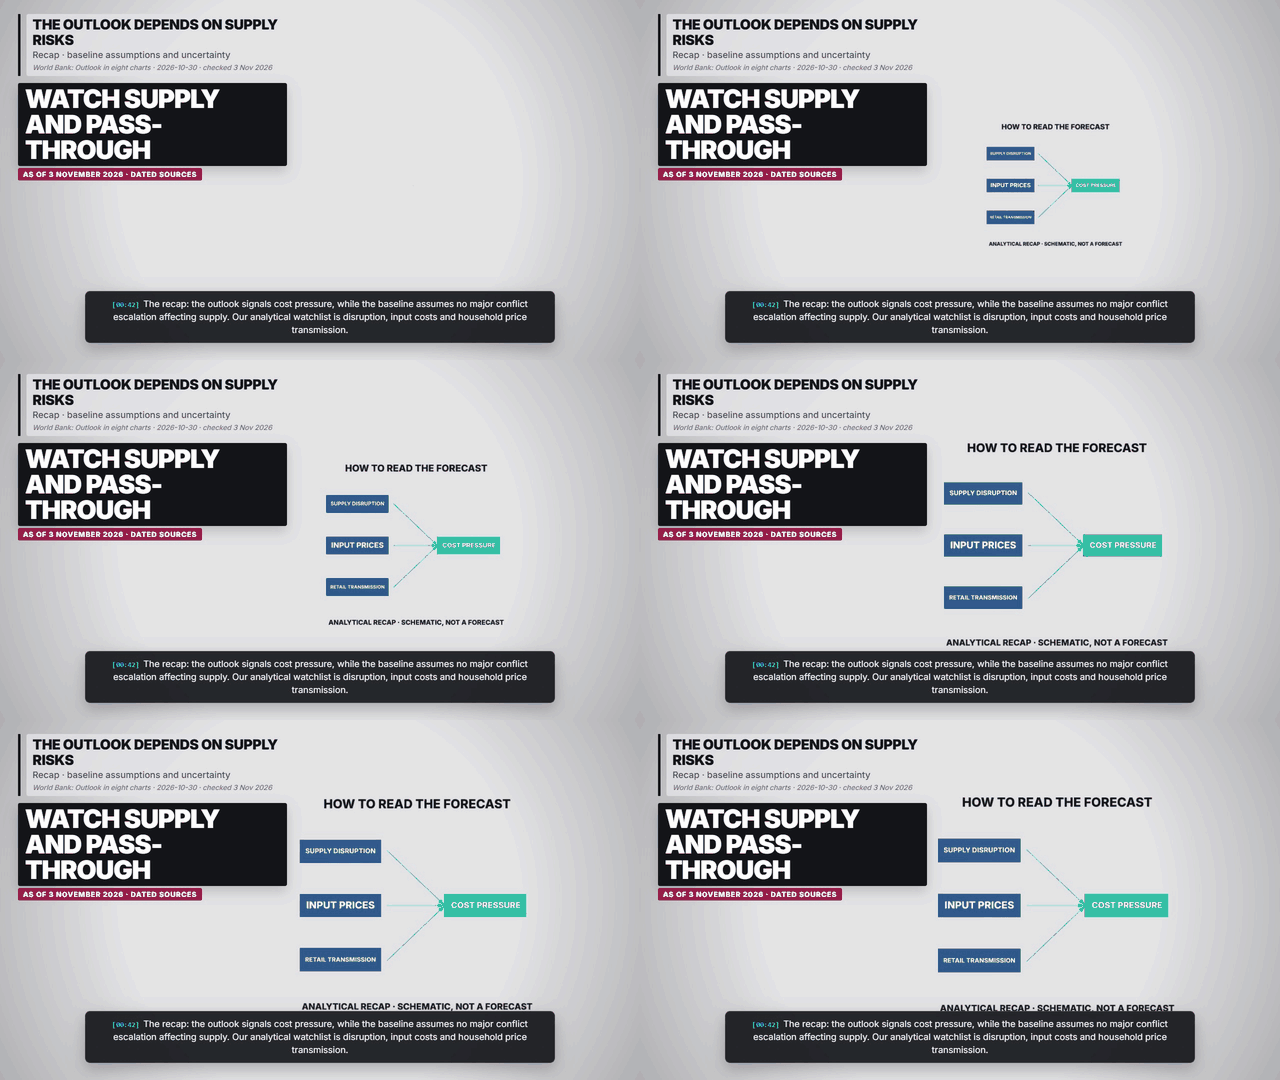
The baseline assumes no major intensification of conflicts affecting commodity supply. Our analytical reading is that supply disruption and the ability of producers and buyers to adjust are more useful watchpoints than treating an annual-average projection as a daily price target. Source and qualifications.
Charts, maps and diagrams from the explainer
Frequently asked questions
Is 23% a consumer inflation forecast?
No. It is a forecast change in the World Bank commodity price index, not a consumer price index.
Is $91 today’s oil price?
No. It is the baseline forecast for the 2026 annual-average Brent price.
Sources and reporting scope
World Bank: October commodity outlook release. 2026-10-28. Baseline forecasts of annual-average commodity prices, not realised full-year results or consumer inflation.
World Bank: Outlook in eight charts. 2026-10-30. Companion explanation of the commodity outlook and transmission of supply and input-cost shocks.
As of 3 November 2026. Forecast vintage: World Bank Commodity Markets Outlook, 28 October 2026. Annual changes compare annual-average prices with the preceding year; 2026 remains a forecast. Energy and all-commodity indexes overlap and must not be added. The baseline assumes no major intensification of conflicts affecting supply. Diagrams illustrate transmission; no quantified pass-through to household bills is claimed. Re-check before re-rendering.