COMMODITY PRICES ARE FORECAST TO RISE 23%
2026 annual-average price change · World Bank baseline

+23% IN 2026 · FORECAST
AS OF 3 NOVEMBER 2026 · DATED SOURCES
Transcript

Full transcript

The narration below matches the explainer. Its original reporting dates and qualifications still apply.

Read the companion article

COMMODITY PRICES ARE FORECAST TO RISE 23%

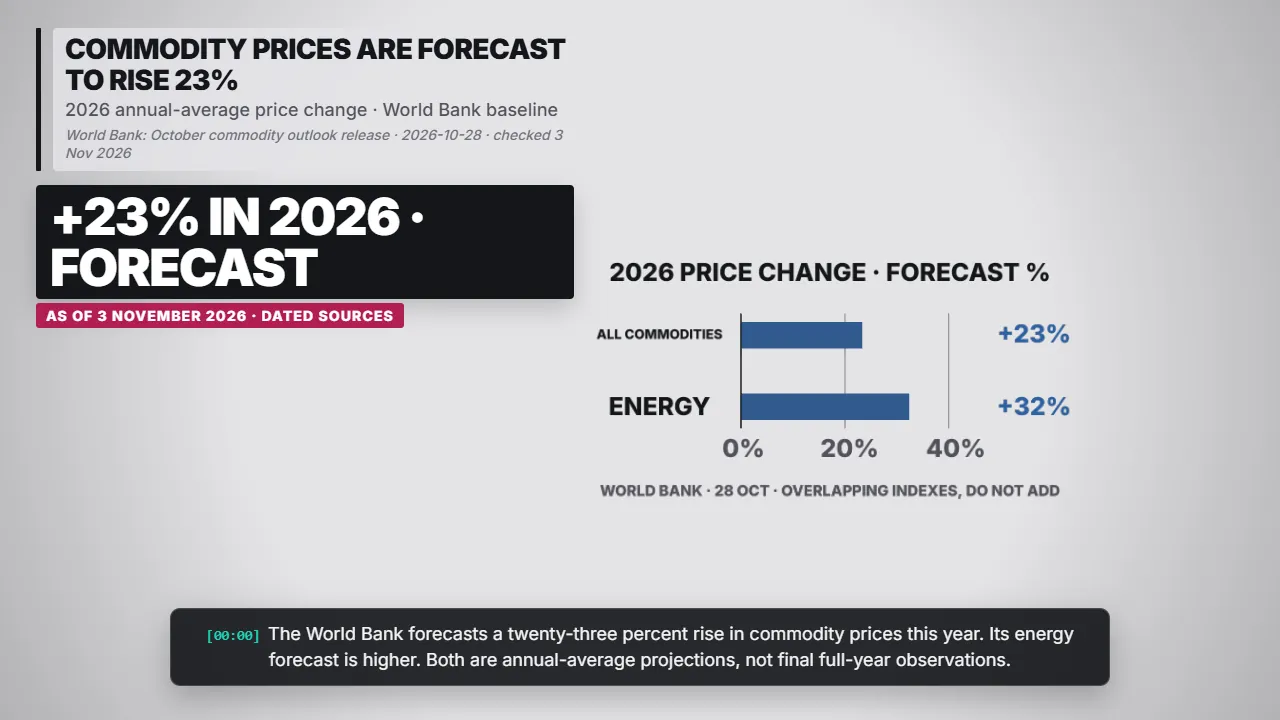
Bar chart: Commodity prices are forecast to rise 23% — +23% in 2026 · Forecast. The World Bank forecasts a twenty-three percent rise in commodity prices this year.
Commodity prices are forecast to rise 23% — +23% in 2026 · Forecast World Bank: October commodity outlook release · 2026-10-28 · checked 3 Nov 2026

The World Bank forecasts a twenty-three percent rise in commodity prices this year. Its energy forecast is higher. Both are annual-average projections, not final full-year observations.

World Bank: October commodity outlook release · 2026-10-28 · checked 3 Nov 2026

THE BASELINE SEES OIL EASING NEXT YEAR
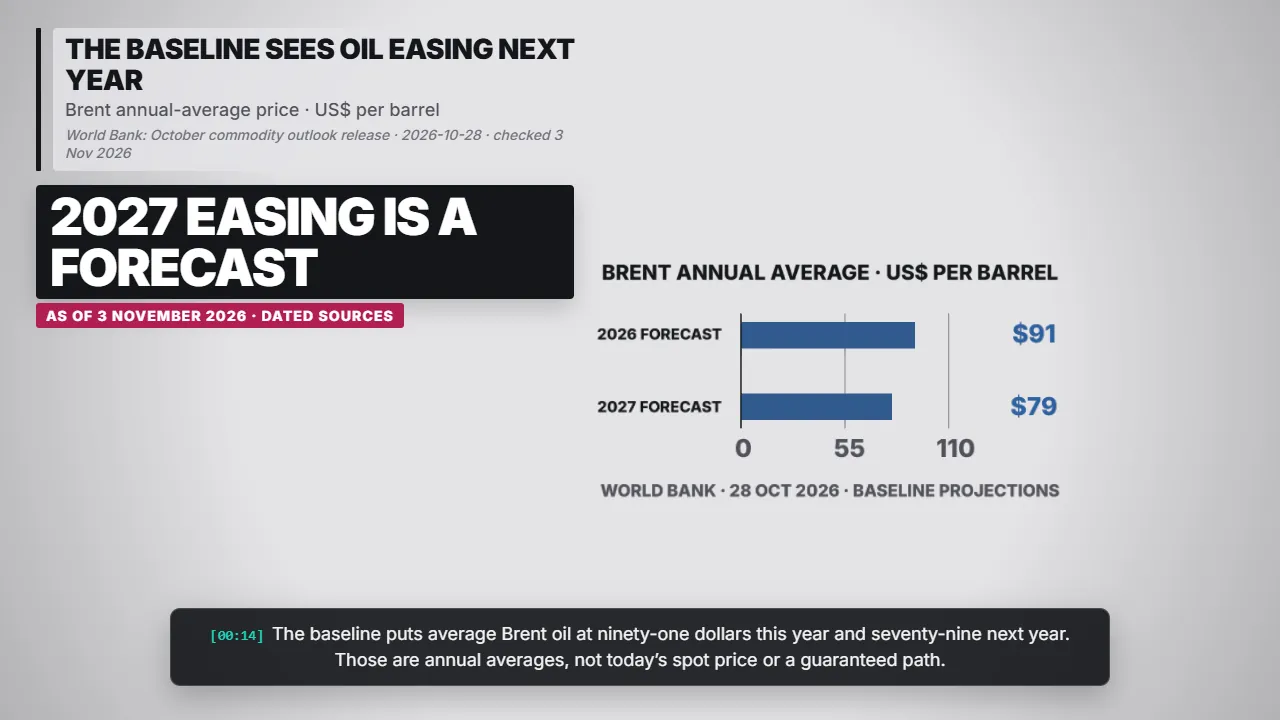
Bar chart: The baseline sees oil easing next year — 2027 easing is a forecast. The baseline puts average Brent oil at ninety-one dollars this year and seventy-nine next year.
The baseline sees oil easing next year — 2027 easing is a forecast World Bank: October commodity outlook release · 2026-10-28 · checked 3 Nov 2026

The baseline puts average Brent oil at ninety-one dollars this year and seventy-nine next year. Those are annual averages, not today’s spot price or a guaranteed path.

World Bank: October commodity outlook release · 2026-10-28 · checked 3 Nov 2026

INPUT COSTS CAN REACH HOUSEHOLD BUDGETS
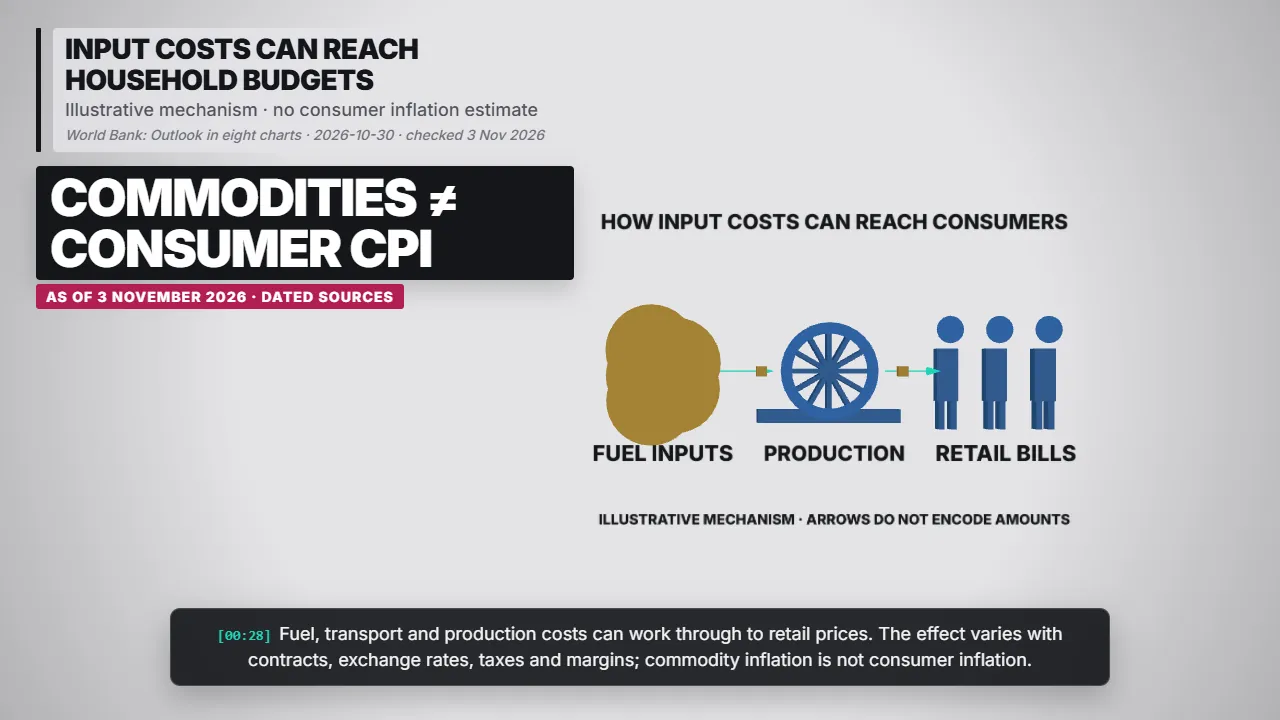
Flow diagram: Input costs can reach household budgets — Commodities ≠ consumer CPI. Fuel, transport and production costs can work through to retail prices.
Input costs can reach household budgets — Commodities ≠ consumer CPI World Bank: Outlook in eight charts · 2026-10-30 · checked 3 Nov 2026

Fuel, transport and production costs can work through to retail prices. The effect varies with contracts, exchange rates, taxes and margins; commodity inflation is not consumer inflation.

World Bank: Outlook in eight charts · 2026-10-30 · checked 3 Nov 2026

THE OUTLOOK DEPENDS ON SUPPLY RISKS
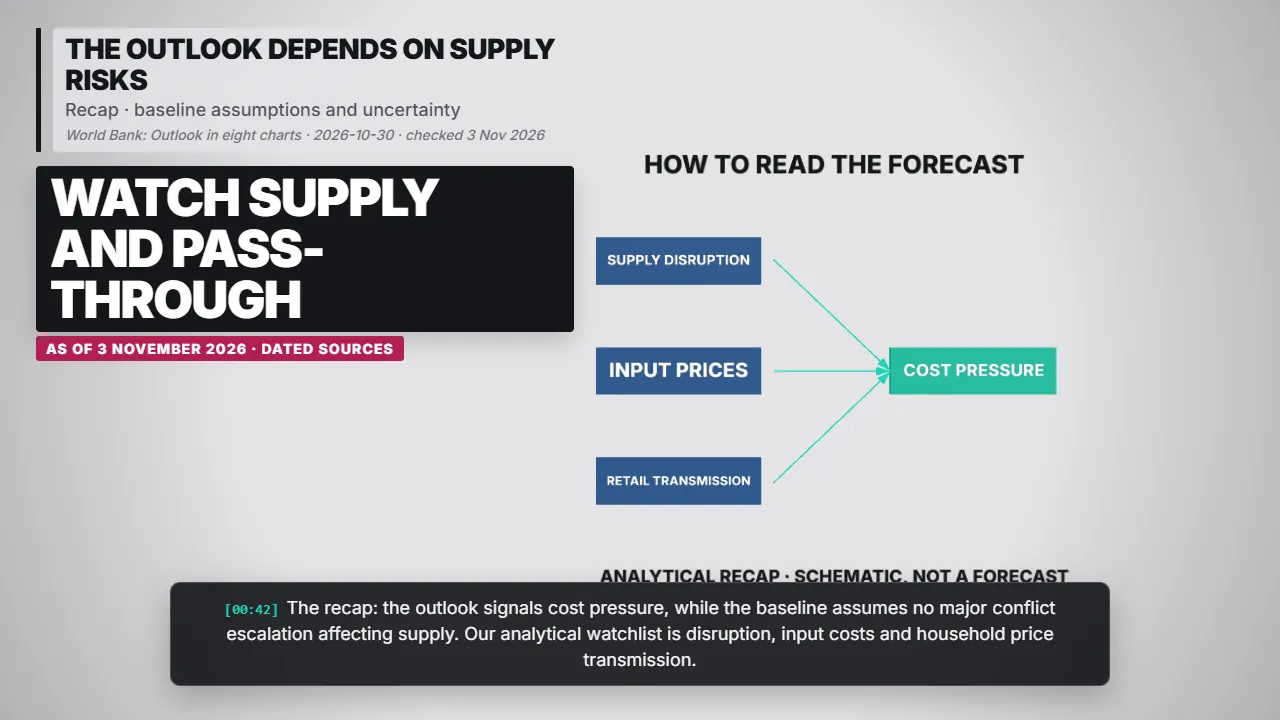
Network diagram: The outlook depends on supply risks — Watch supply and pass-through. The recap: the outlook signals cost pressure, while the baseline assumes no major conflict escalation affecting supply.
The outlook depends on supply risks — Watch supply and pass-through World Bank: Outlook in eight charts · 2026-10-30 · checked 3 Nov 2026

The recap: the outlook signals cost pressure, while the baseline assumes no major conflict escalation affecting supply. Our analytical watchlist is disruption, input costs and household price transmission.

World Bank: Outlook in eight charts · 2026-10-30 · checked 3 Nov 2026

SOURCES AND QUALIFICATIONS

The World Bank’s October outlook and companion charts are the sources. These are baseline forecasts, not final outcomes. Annual commodity averages differ from daily prices and consumer inflation.

World Bank: October commodity outlook release · 2026-10-28 · checked 3 Nov 2026

Source links

All Explainers
[00:00]
Read the full article

The Commodity Shock: World Bank Forecasts a 23% Rise

As of 3 November 2026. Forecast vintage: World Bank Commodity Markets Outlook, 28 October 2026. Annual changes compare annual-average prices with the preceding year; 2026 remains a forecast. Energy and all-commodity indexes overlap and must not be added. The baseline assumes no major intensification of conflicts affecting supply. Diagrams illustrate transmission; no quantified pass-through to household bills is claimed. Re-check before re-rendering.

World Bank: October commodity outlook release. 2026-10-28. Baseline forecasts of annual-average commodity prices, not realised full-year results or consumer inflation.

World Bank: Outlook in eight charts. 2026-10-30. Companion explanation of the commodity outlook and transmission of supply and input-cost shocks.