Eurozone Growth: Resilience With Uneven Results
The preliminary Q3 2026 GDP release explained: eurozone growth of 0.4%, a slower quarterly pace and uneven national results.
Explore the five-scene explainerKey takeaways
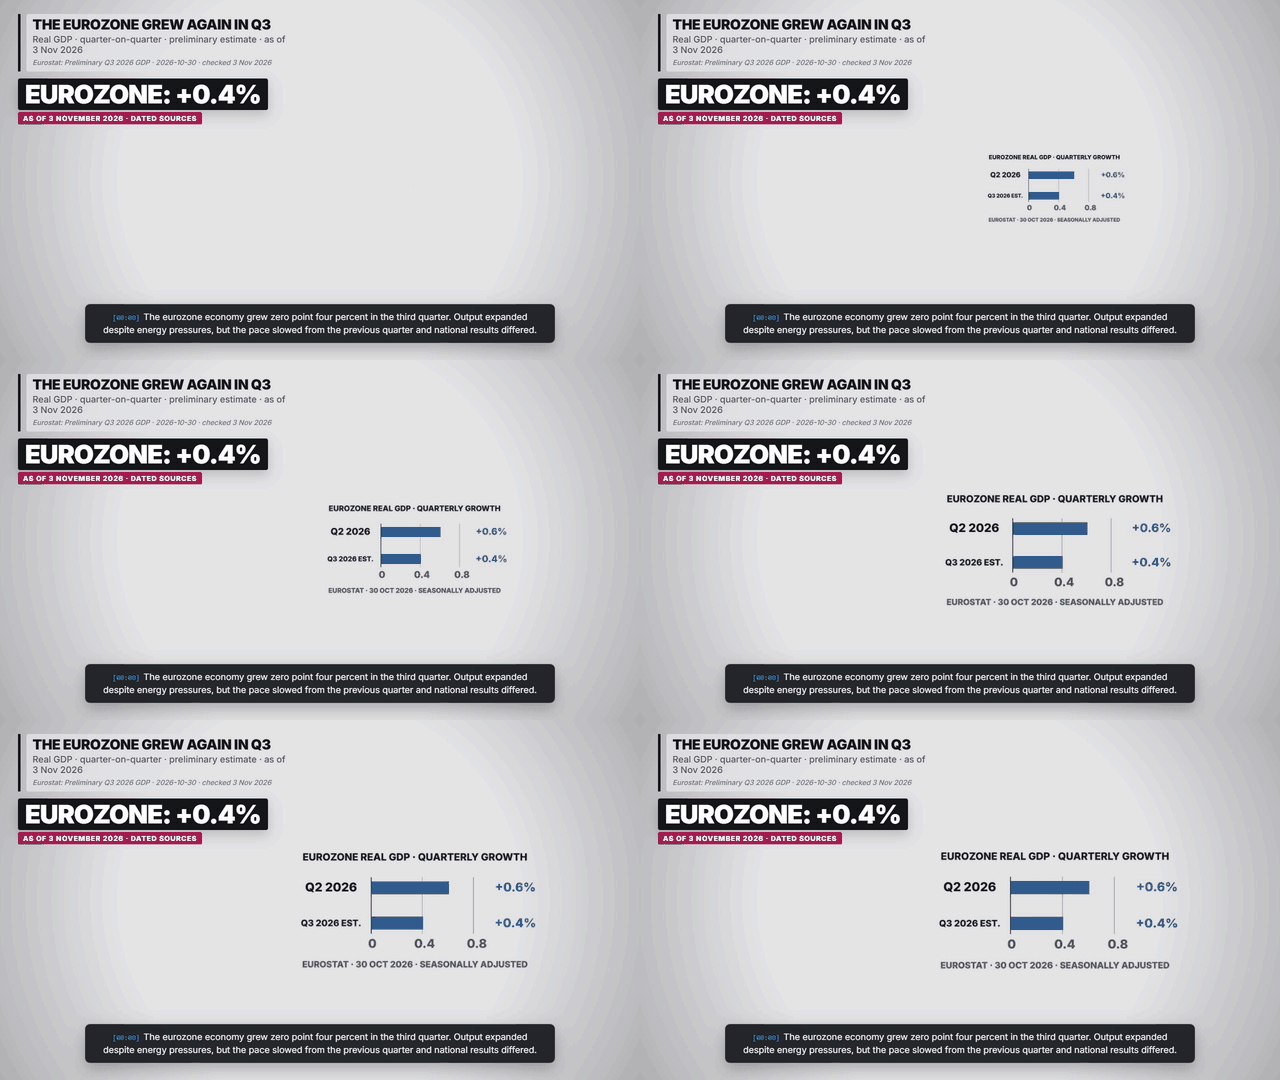
- Preliminary eurozone GDP grew 0.4% quarter-on-quarter in Q3, following 0.6% in Q2.
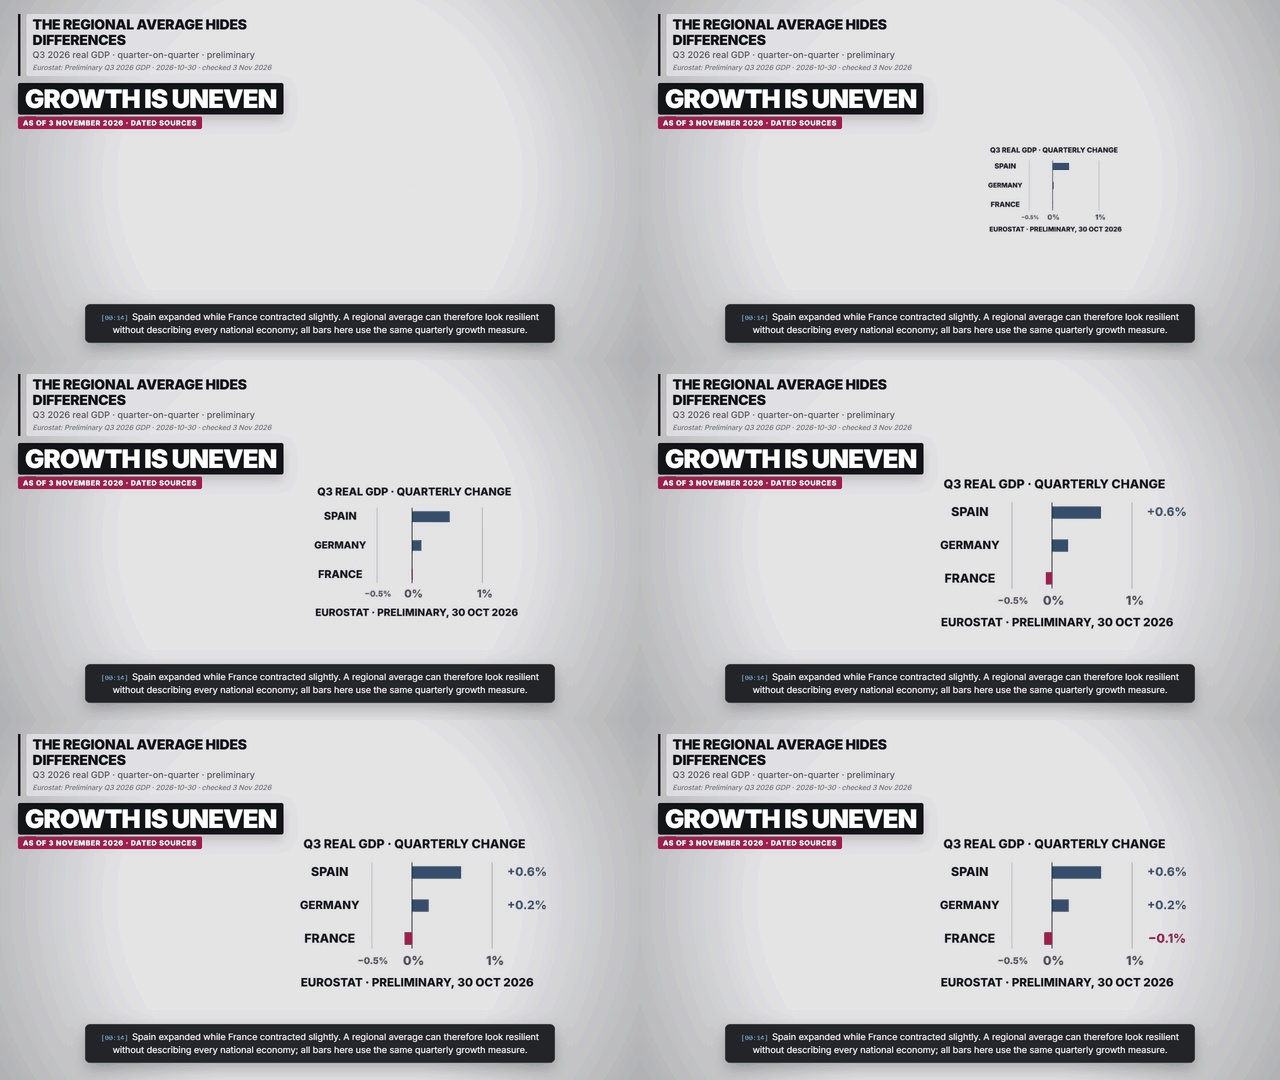
- The aggregate masks different national outcomes.
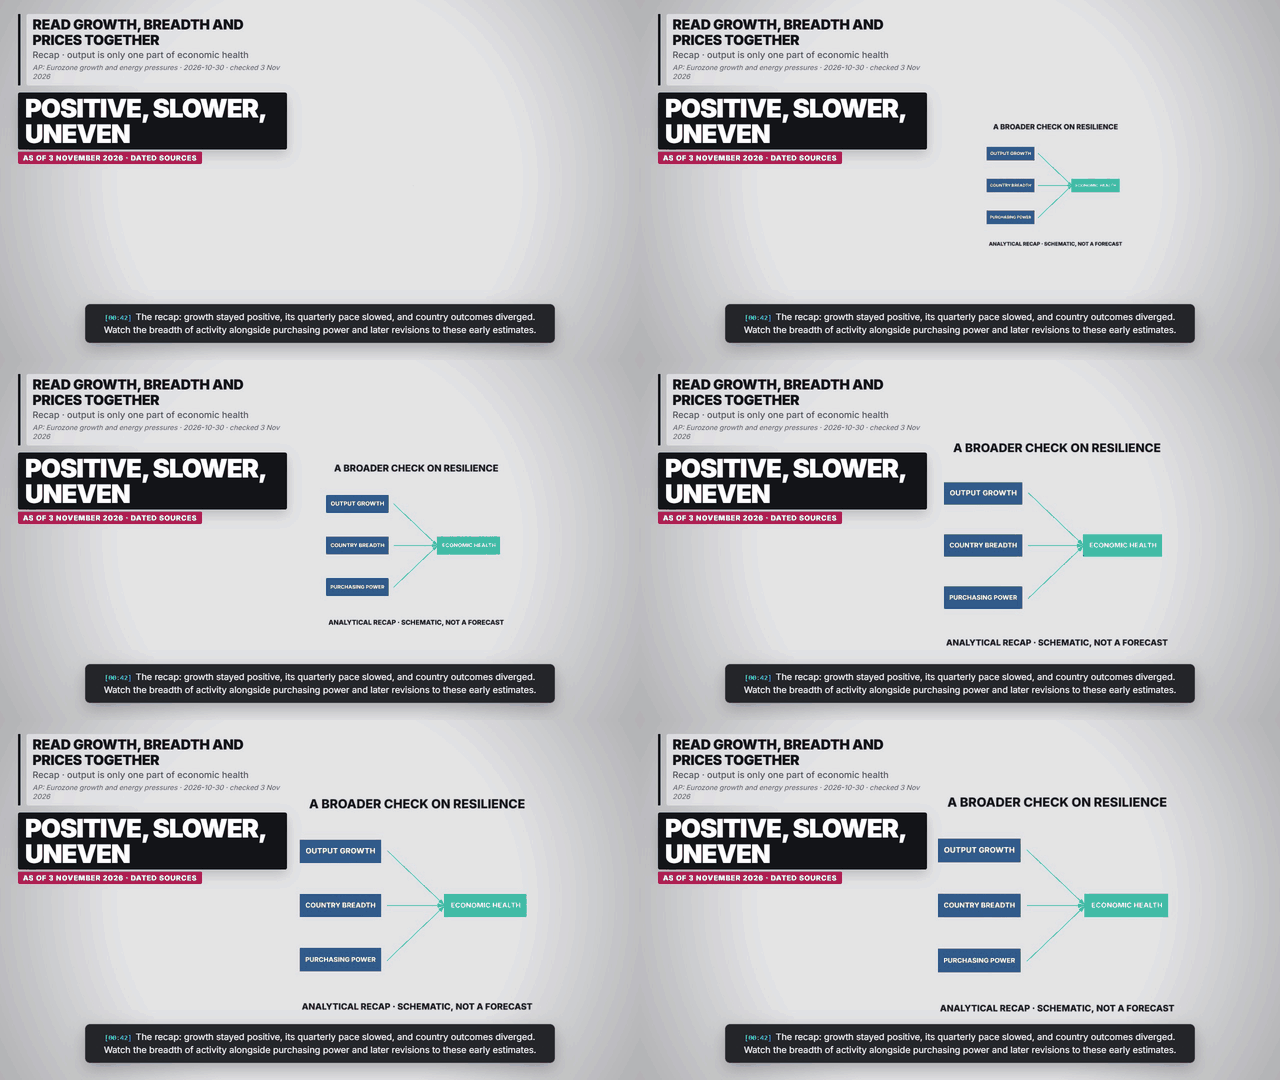
- Growth is not a measure of whether household purchasing power improved.
Sourced figures and status
| Period | Figure or status | Source |
|---|---|---|
| Q2 → Q3 2026, quarterly | Eurozone real GDP growth: +0.6% → +0.4% (Q3 preliminary). | Eurostat: Preliminary Q3 2026 GDP · 2026-10-30 |
| Q3 2026, quarterly preliminary | Spain +0.6%; Germany +0.2%; France −0.1%. | Eurostat: Preliminary Q3 2026 GDP · 2026-10-30 |
| Q3 2026, year-on-year preliminary | Eurozone real GDP +1.3%; a different comparison from quarterly growth. | Eurostat: Preliminary Q3 2026 GDP · 2026-10-30 |
What does resilience mean here?
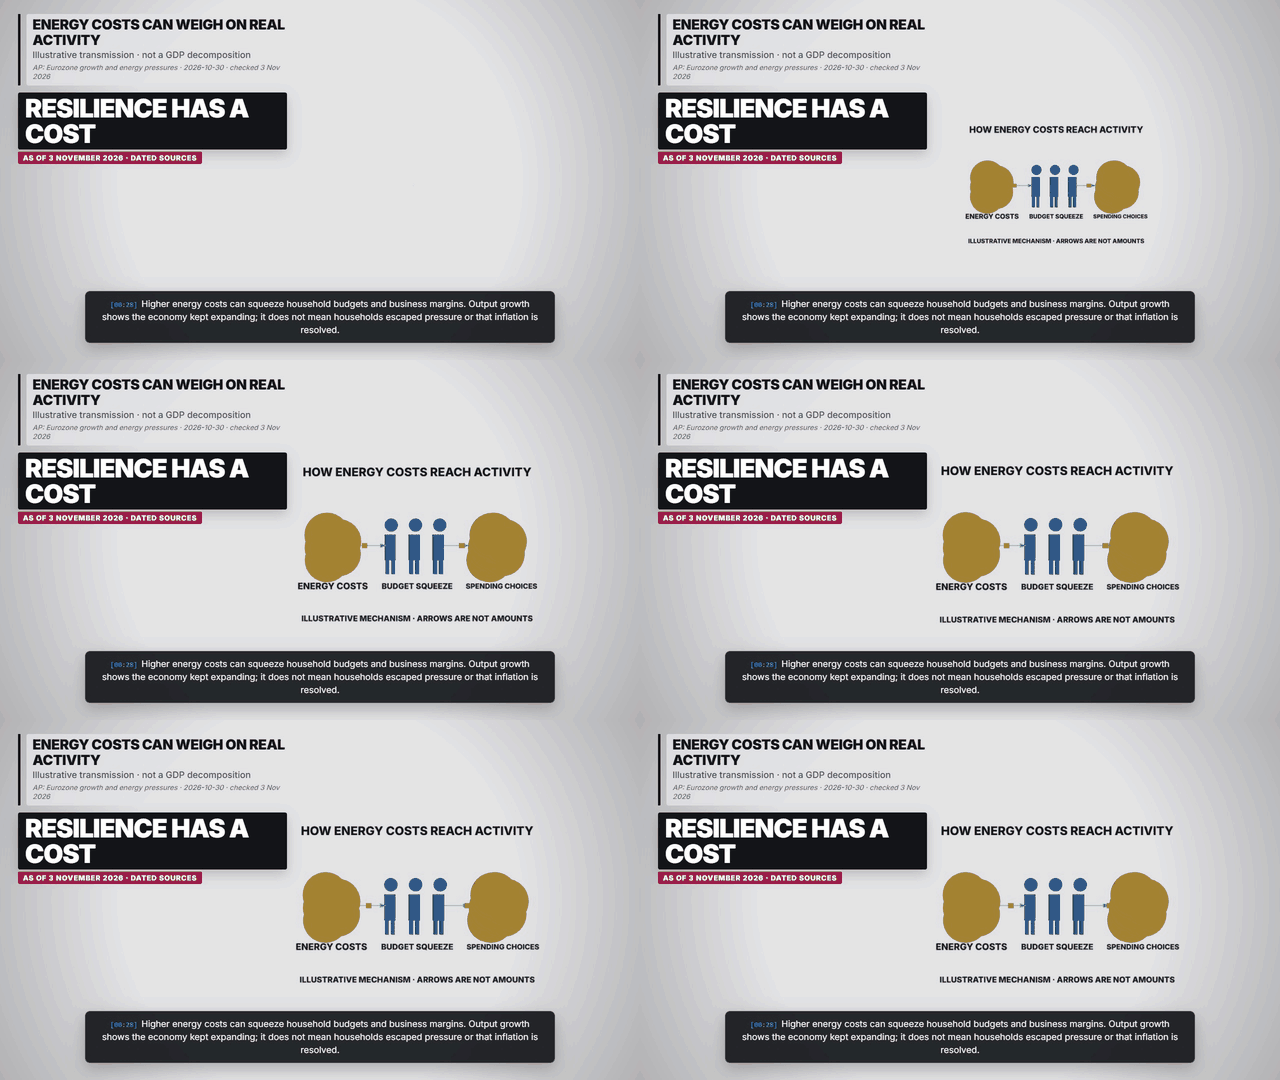
The region continued to expand despite energy pressures. That is a useful observation about total output. It does not establish that every sector or household is doing well, or that price pressures have disappeared. Source and qualifications.
Why avoid one simple European story?
The regional figure combines economies with different sizes and growth patterns. Our analytical reading is that both the aggregate and national detail matter. These flash estimates can change as more information becomes available. Source and qualifications.
Charts, maps and diagrams from the explainer
Frequently asked questions
Is 0.4% annual growth?
No. It is seasonally adjusted growth from Q2 to Q3 2026, not an annualised rate.
Are these final figures?
No. Eurostat labels them preliminary estimates subject to revision.
Sources and reporting scope
Eurostat: Preliminary Q3 2026 GDP. 2026-10-30. Seasonally adjusted real GDP; preliminary estimates subject to revision.
AP: Eurozone growth and energy pressures. 2026-10-30. Independent context on uneven growth and energy pressures.
Reuters: Eurozone growth and country detail. 2026-10-30. Cross-check of growth and country figures; inflation outlook is separate from the GDP release.
Re-checked 3 November 2026 against Eurostat and Reuters. Eurostat release dated 30 October; preliminary, seasonally adjusted real GDP for July–September 2026. Quarterly and annual rates are separate measures. Country comparisons use the same quarterly basis; national results and aggregate weights differ. Diagrams are illustrative, not quantified contributions. Re-check before re-rendering.