THE EUROZONE GREW AGAIN IN Q3

Real GDP · quarter-on-quarter · preliminary estimate · as of 3 Nov 2026

EUROZONE: +0.4%
AS OF 3 NOVEMBER 2026 · DATED SOURCES
Transcript

Full transcript

The narration below matches the explainer. Its original reporting dates and qualifications still apply.

Read the companion article

THE EUROZONE GREW AGAIN IN Q3

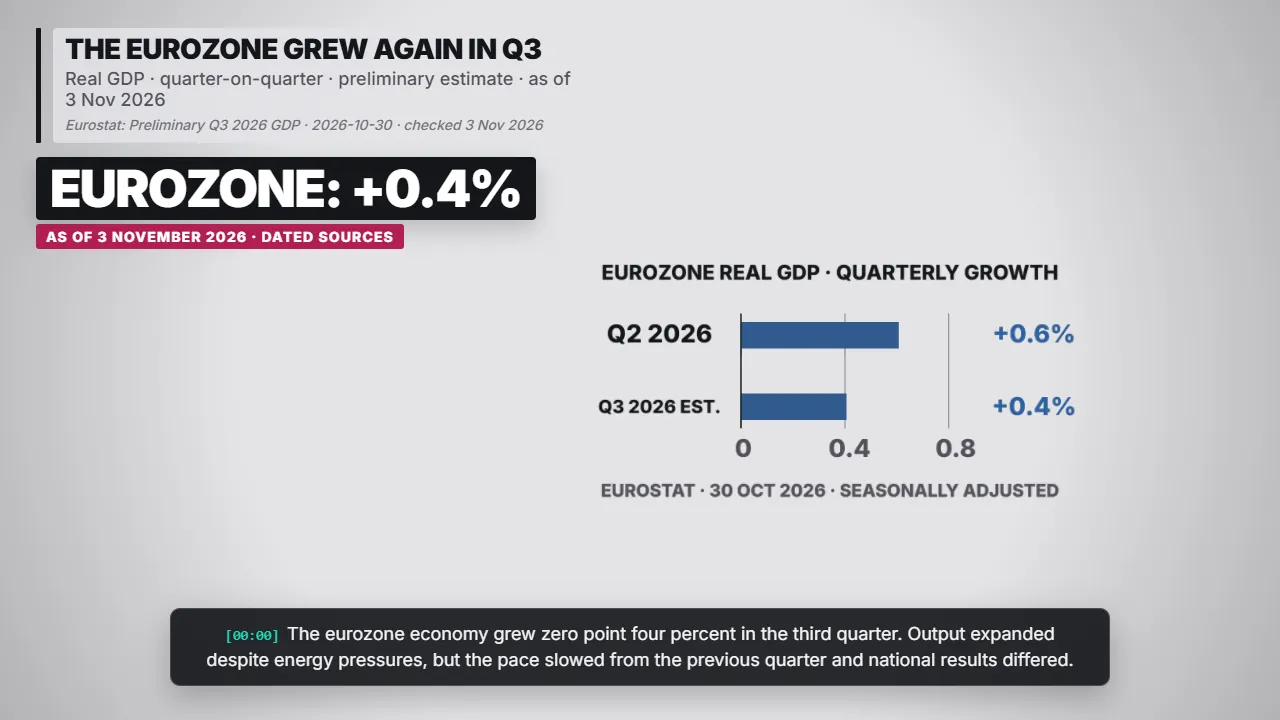
Bar chart: The eurozone grew again in q3 — Eurozone: +0.4%. The eurozone economy grew zero point four percent in the third quarter.
The eurozone grew again in q3 — Eurozone: +0.4% Eurostat: Preliminary Q3 2026 GDP · 2026-10-30 · checked 3 Nov 2026

The eurozone economy grew zero point four percent in the third quarter. Output expanded despite energy pressures, but the pace slowed from the previous quarter and national results differed.

Eurostat: Preliminary Q3 2026 GDP · 2026-10-30 · checked 3 Nov 2026

THE REGIONAL AVERAGE HIDES DIFFERENCES
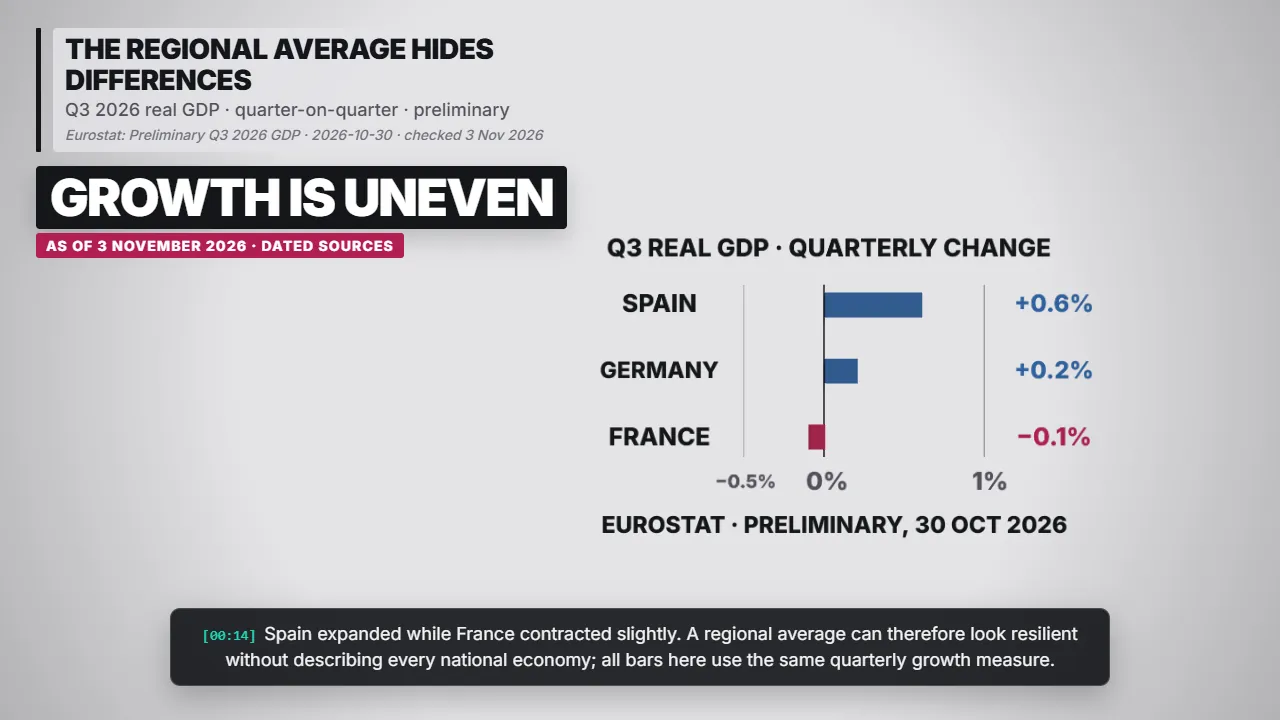
Change chart: The regional average hides differences — Growth is uneven. Spain expanded while France contracted slightly.
The regional average hides differences — Growth is uneven Eurostat: Preliminary Q3 2026 GDP · 2026-10-30 · checked 3 Nov 2026

Spain expanded while France contracted slightly. A regional average can therefore look resilient without describing every national economy; all bars here use the same quarterly growth measure.

Eurostat: Preliminary Q3 2026 GDP · 2026-10-30 · checked 3 Nov 2026

ENERGY COSTS CAN WEIGH ON REAL ACTIVITY
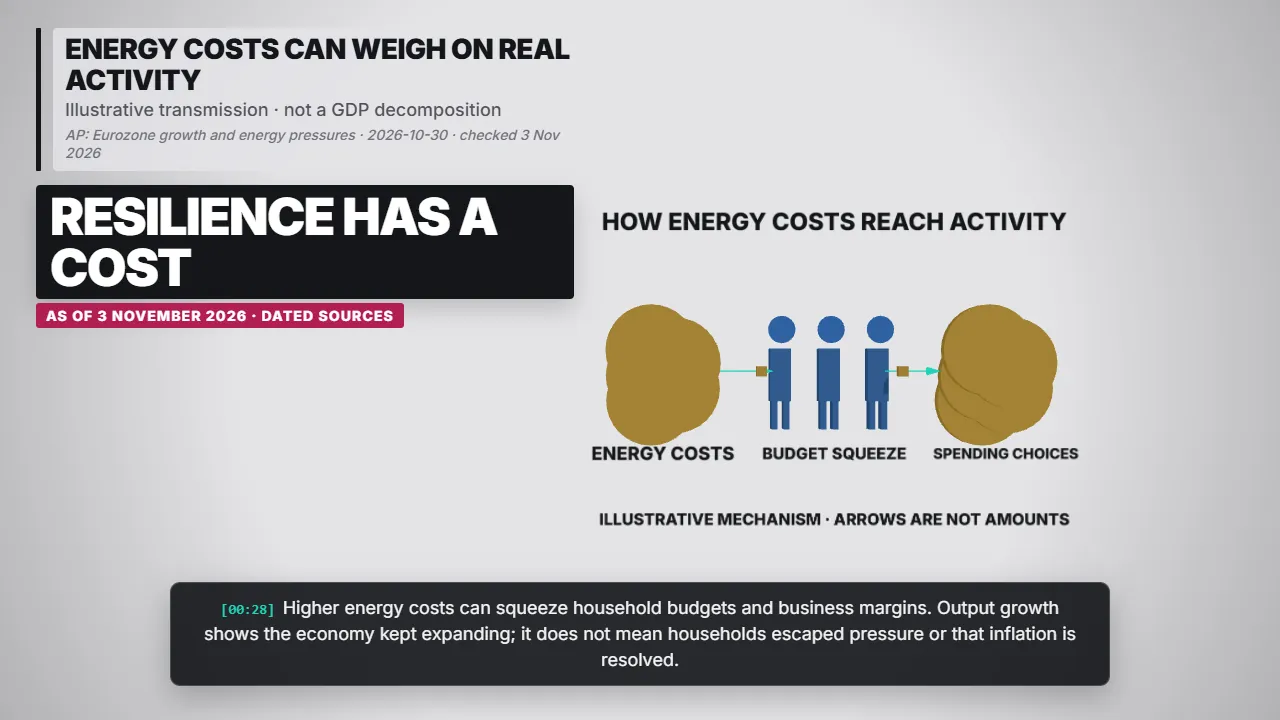
Flow diagram: Energy costs can weigh on real activity — Resilience has a cost. Higher energy costs can squeeze household budgets and business margins.
Energy costs can weigh on real activity — Resilience has a cost AP: Eurozone growth and energy pressures · 2026-10-30 · checked 3 Nov 2026

Higher energy costs can squeeze household budgets and business margins. Output growth shows the economy kept expanding; it does not mean households escaped pressure or that inflation is resolved.

AP: Eurozone growth and energy pressures · 2026-10-30 · checked 3 Nov 2026

READ GROWTH, BREADTH AND PRICES TOGETHER
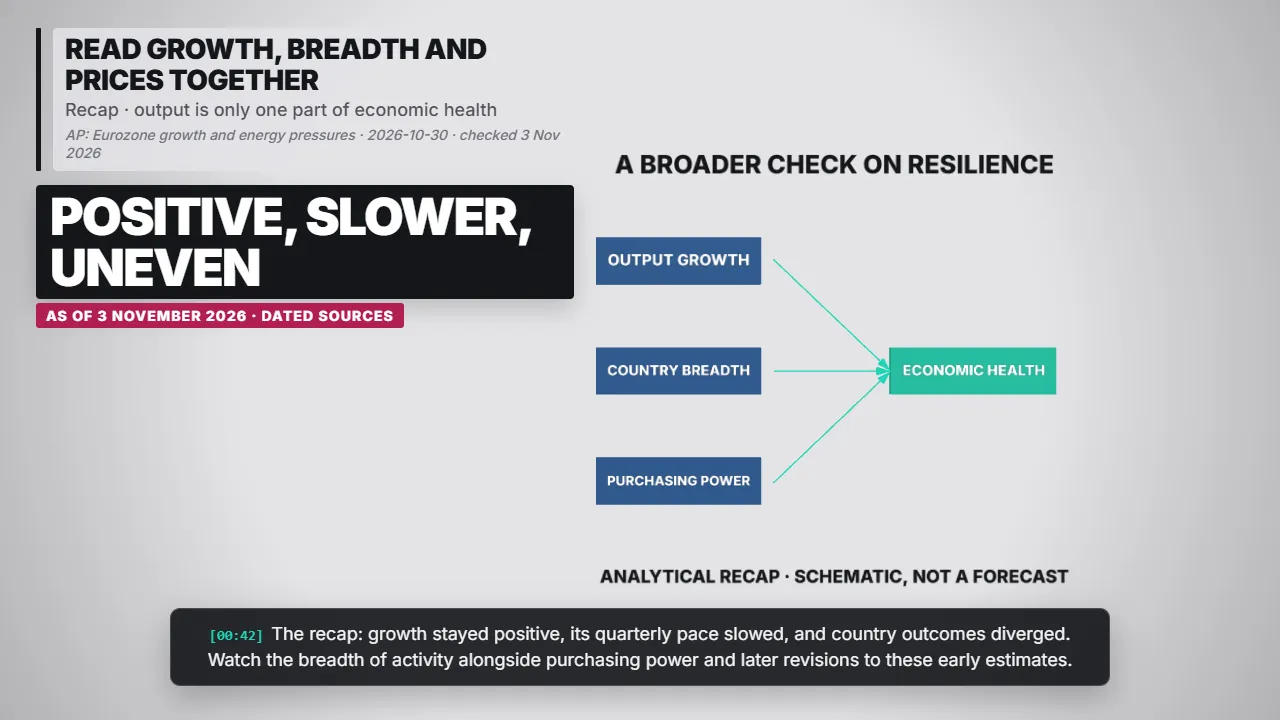
Network diagram: Read growth, breadth and prices together — Positive, slower, uneven. The recap: growth stayed positive, its quarterly pace slowed, and country outcomes diverged.
Read growth, breadth and prices together — Positive, slower, uneven AP: Eurozone growth and energy pressures · 2026-10-30 · checked 3 Nov 2026

The recap: growth stayed positive, its quarterly pace slowed, and country outcomes diverged. Watch the breadth of activity alongside purchasing power and later revisions to these early estimates.

AP: Eurozone growth and energy pressures · 2026-10-30 · checked 3 Nov 2026

SOURCES AND PRELIMINARY STATUS

Eurostat provides the preliminary national accounts and comparable country figures. Associated Press supplies economic context. These early estimates can be revised, and quarterly growth is not an annualised rate.

Eurostat: Preliminary Q3 2026 GDP · 2026-10-30 · checked 3 Nov 2026

Source links

All Explainers
[00:00]
Read the full article

Eurozone Growth: Resilience With Uneven Results

Re-checked 3 November 2026 against Eurostat and Reuters. Eurostat release dated 30 October; preliminary, seasonally adjusted real GDP for July–September 2026. Quarterly and annual rates are separate measures. Country comparisons use the same quarterly basis; national results and aggregate weights differ. Diagrams are illustrative, not quantified contributions. Re-check before re-rendering.

Eurostat: Preliminary Q3 2026 GDP. 2026-10-30. Seasonally adjusted real GDP; preliminary estimates subject to revision.

AP: Eurozone growth and energy pressures. 2026-10-30. Independent context on uneven growth and energy pressures.

Reuters: Eurozone growth and country detail. 2026-10-30. Cross-check of growth and country figures; inflation outlook is separate from the GDP release.