Military Spending: The $2.9 Trillion Question
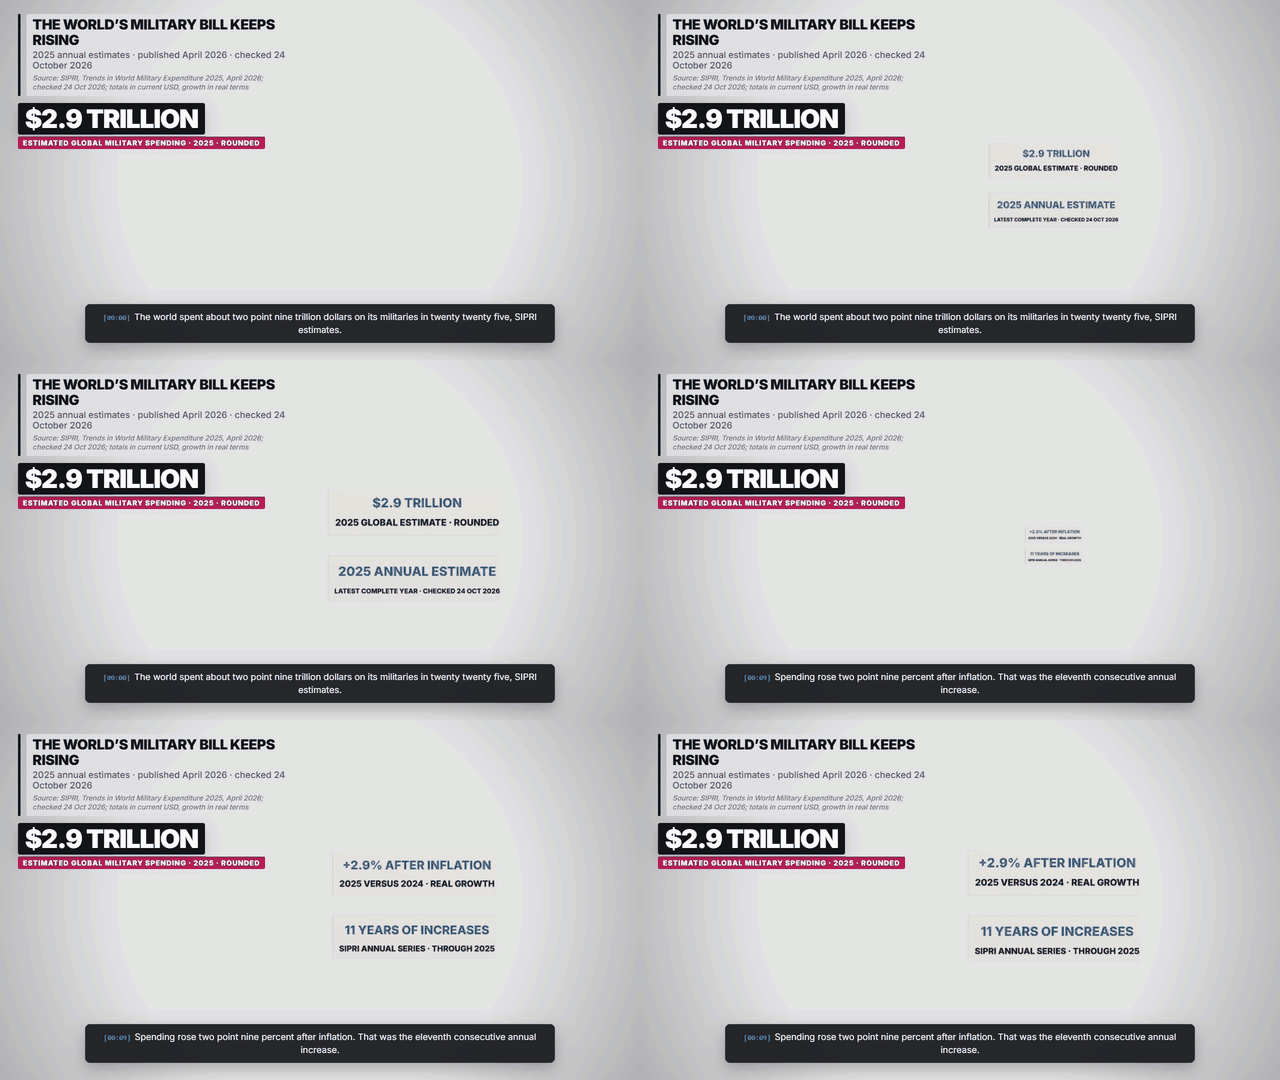
The world’s military bill reached about $2.9 trillion in 2025. The total matters, but so do the year, the price basis and the share of an economy devoted to it. This explainer separates recorded annual estimates from future pledges.
▶ Explore the narrated 3D explainerKey takeaways
- SIPRI estimates a global total of $2,887 billion in 2025, up 2.9% after inflation.
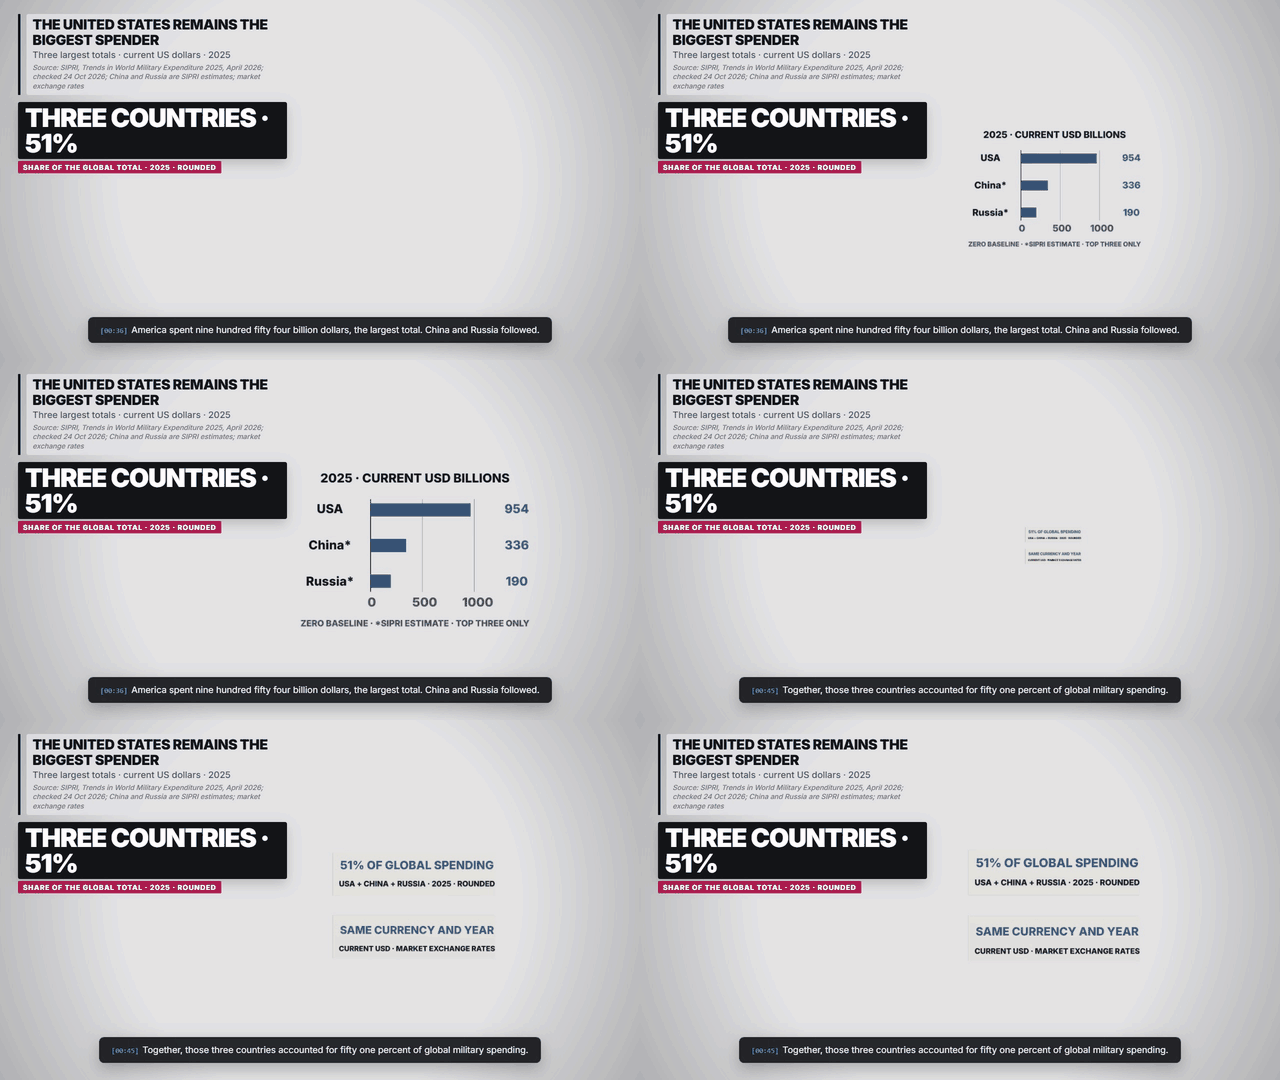
- The USA, China and Russia accounted for a rounded 51% of the total. Dollar rankings differ from GDP burdens.
- NATO’s Hague declaration is a separately dated commitment for 2035, with broader coverage than the spending series used here.
What does the global figure measure?
SIPRI: Trends in World Military Expenditure, 2025 and SIPRI: Global military spending release, published in April 2026, report the eleventh consecutive annual increase in world military expenditure. The latest complete annual observations available in SIPRI: Database coverage and update cover 2025. The headline rounds the published $2,887 billion to $2.9 trillion; it does not describe a completed 2026 total.
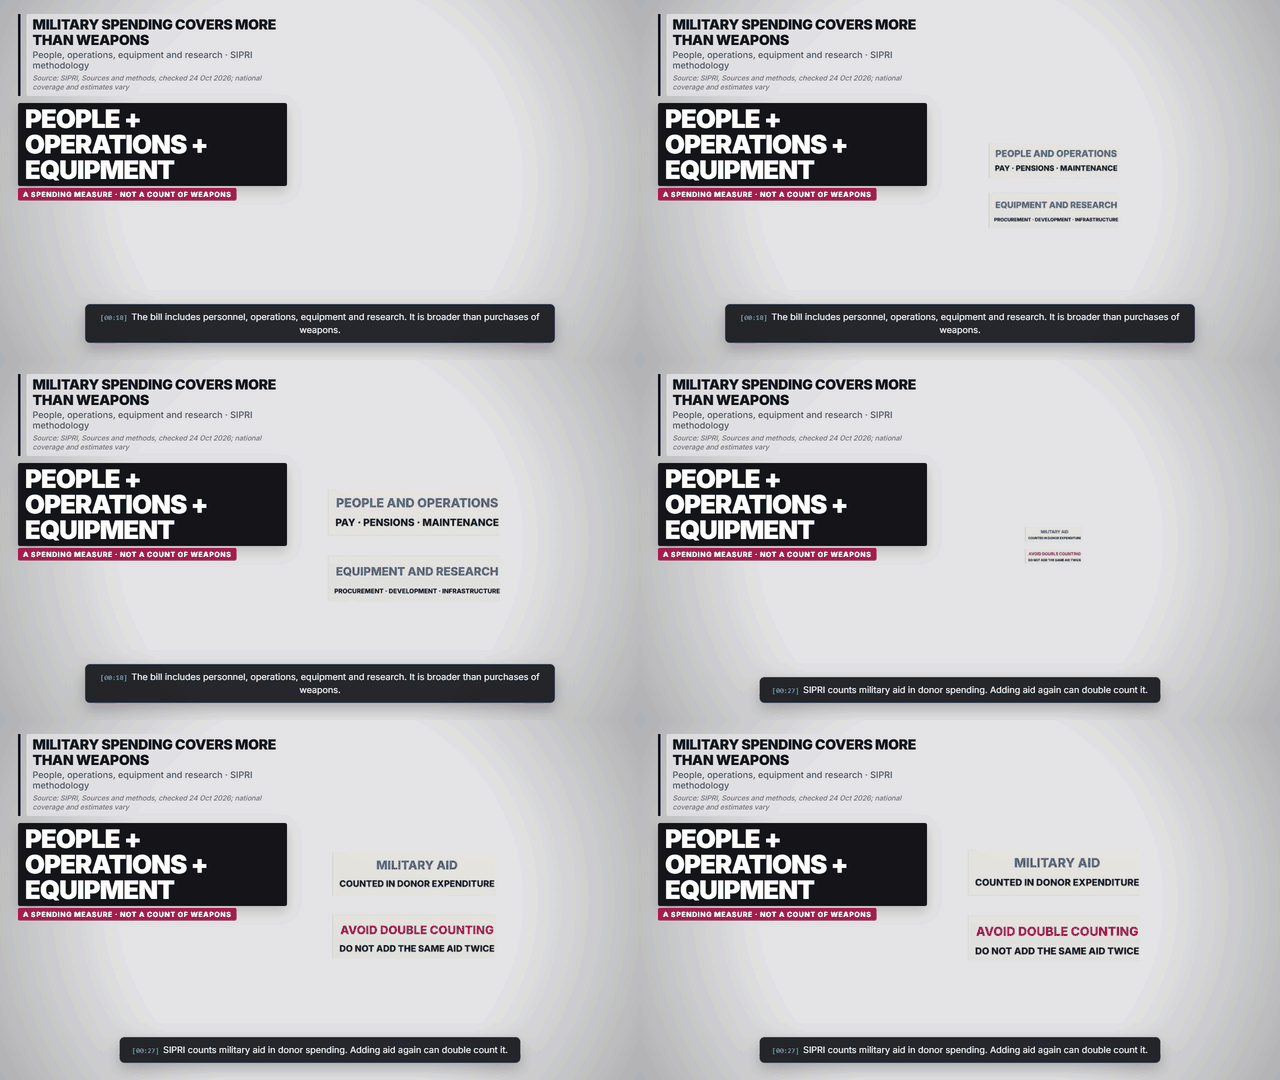
SIPRI: Sources and methods includes people, operations and maintenance, procurement, research and military infrastructure. Weapons purchases are only part of this expenditure. Military aid is included in donor spending, so adding the same aid again can double count it. Coverage and transparency vary across national accounts, and recent estimates can be revised.
Who spends the most?
| Coverage | 2025 current USD billions | Basis and caveat | Source |
|---|---|---|---|
| World | $2,887 billion | Estimated aggregate; about $2.9 trillion | SIPRI: Trends in World Military Expenditure, 2025 |
| United States | $954 billion | Largest reported total | SIPRI: Trends in World Military Expenditure, 2025 |
| China | $336 billion | SIPRI estimate | SIPRI: Trends in World Military Expenditure, 2025 |
| Russia | $190 billion | SIPRI estimate | SIPRI: Trends in World Military Expenditure, 2025 |
The three-country chart starts at zero and uses one 0–1,000 USD-billion scale. The top-three share, 51%, is SIPRI’s rounded published value. Dollar conversion uses market exchange rates, not purchasing-power parity. These totals describe expenditure; differences in prices, pay, equipment and effectiveness prevent a direct reading as military capability.
Why did the total rise despite a US decline?
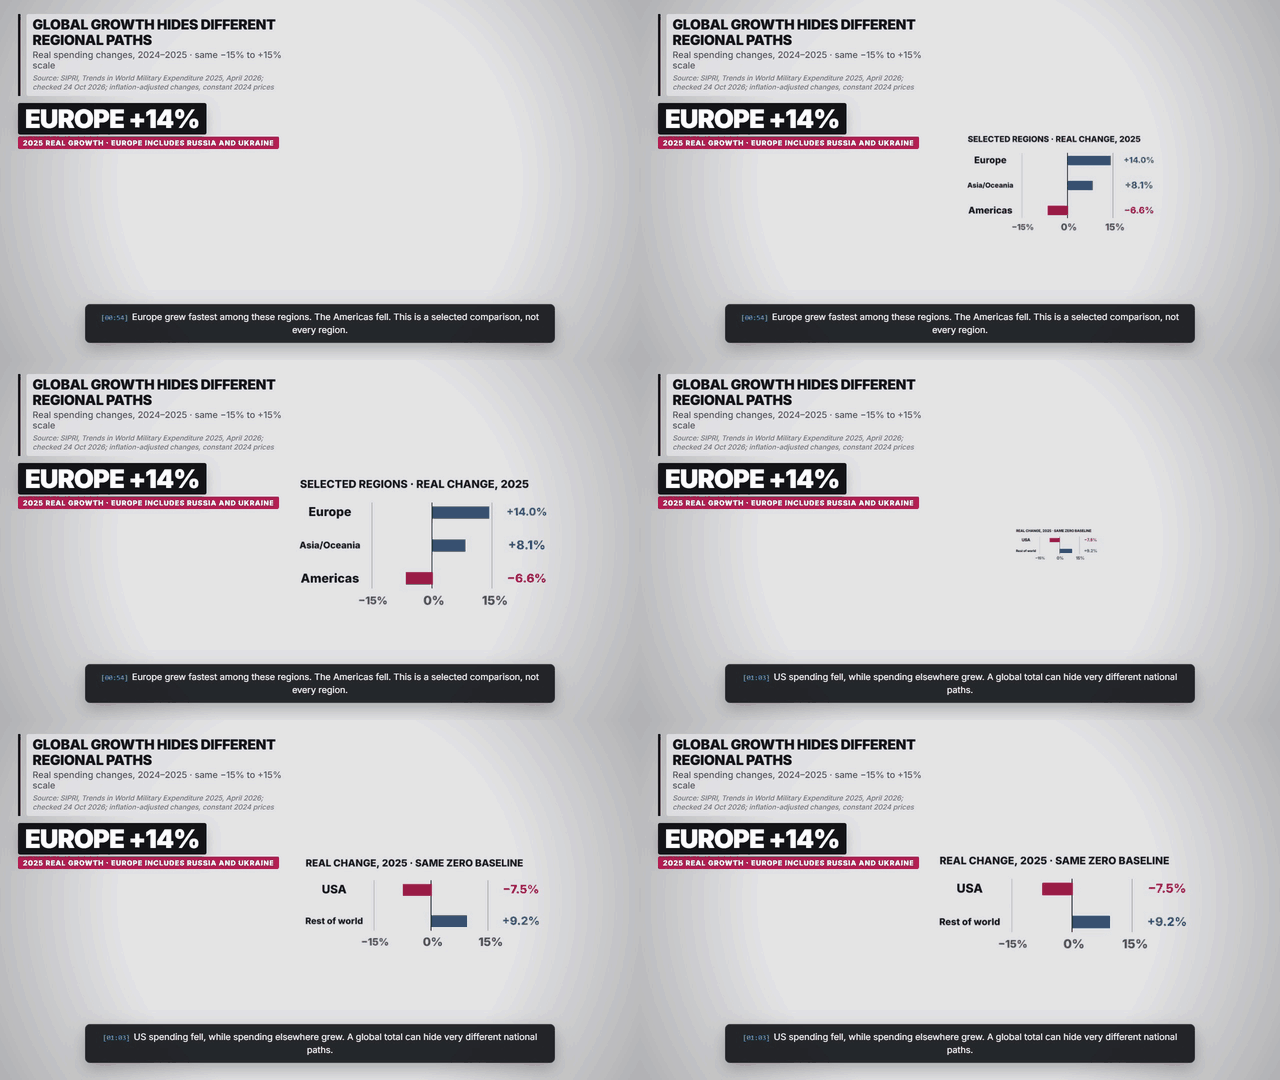
SIPRI reports stronger spending in Europe and Asia alongside a US decrease. Its account connects European increases to the Russia–Ukraine war and rearmament, and discusses regional tensions in Asia. Those are its interpretation of the drivers, rather than a controlled estimate of each cause.
| Selected region or comparison group | Real change, 2024–2025 | Scope |
|---|---|---|
| Europe | +14.0% | Includes Russia and Ukraine; not just the EU or NATO |
| Asia and Oceania | +8.1% | SIPRI region |
| Americas | −6.6% | SIPRI region |
| United States | −7.5% | Separate country-versus-rest comparison |
| World excluding the USA | +9.2% | Separate country-versus-rest comparison |
Sources: SIPRI: Trends in World Military Expenditure, 2025 and SIPRI: Global military spending release. Changes are inflation-adjusted, using constant 2024 prices. Both growth charts use −15% to +15% axes and a shared zero line. These selected rows overlap and must not be added together; regional rates are not contributions to global growth.
Economic burden asks a different question
| Selected country | 2025 military spending / GDP | Basis |
|---|---|---|
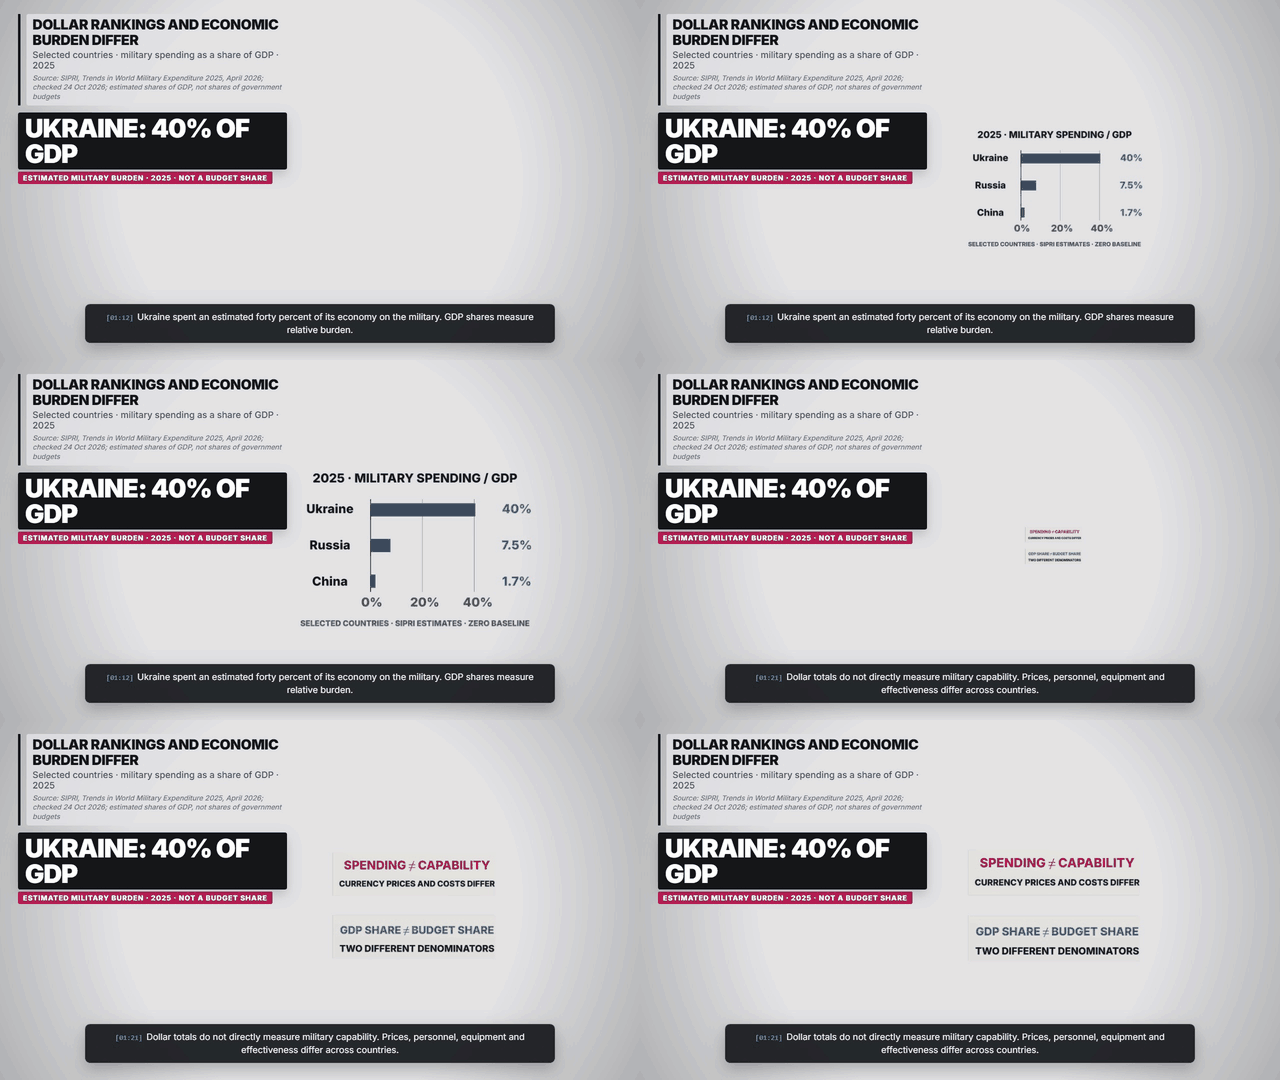
| Ukraine | 40% | SIPRI estimate |
| Russia | 7.5% | SIPRI estimate |
| China | 1.7% | SIPRI estimate |
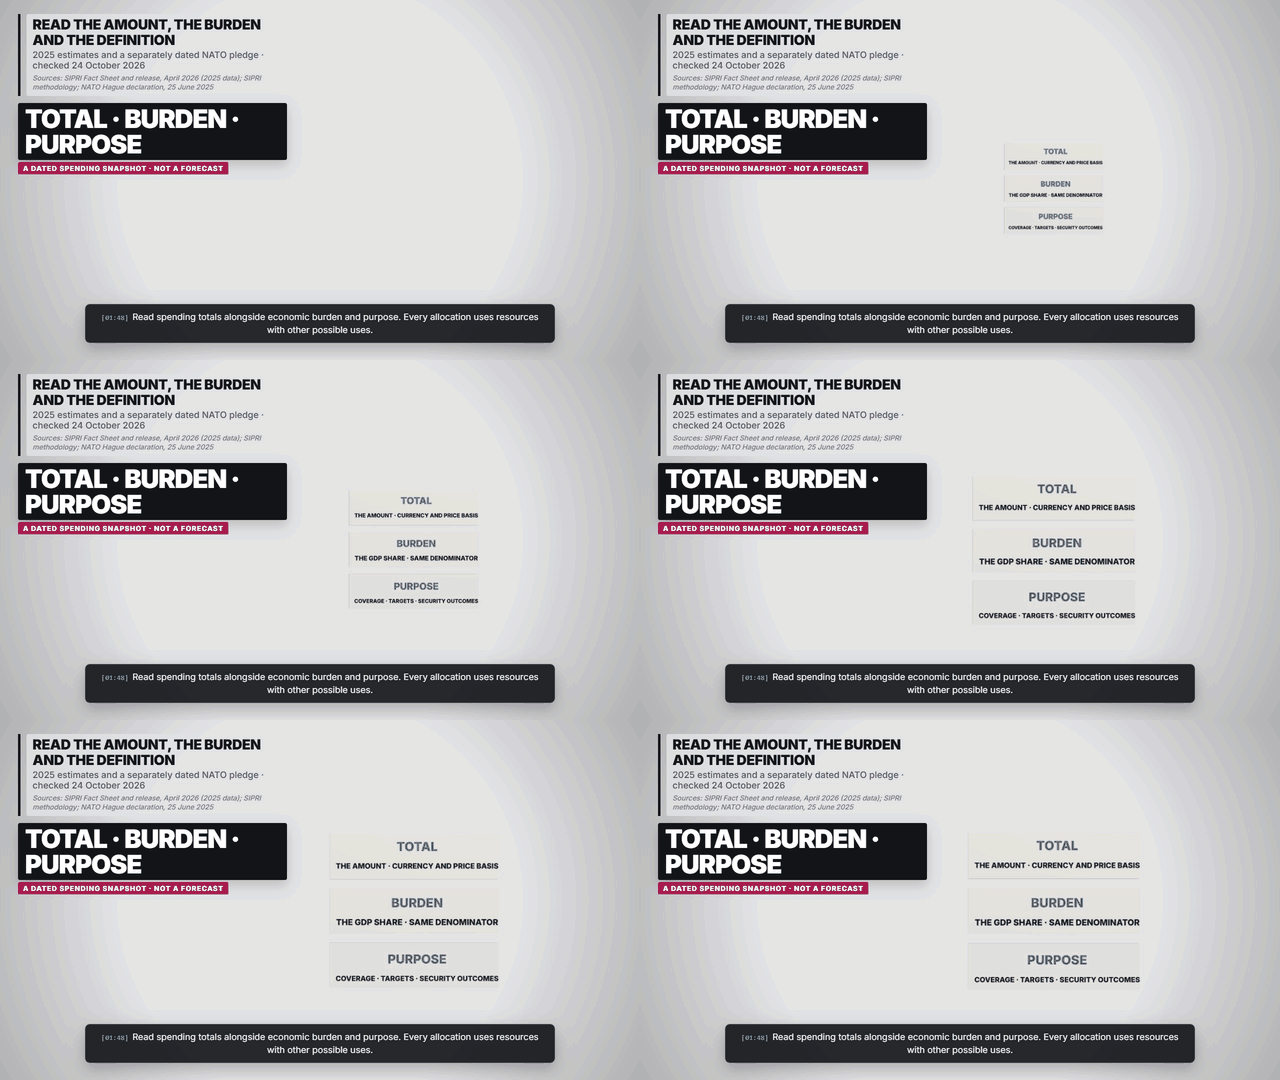
Source: SIPRI: Trends in World Military Expenditure, 2025. This selected-country chart uses one zero-to-40% scale. GDP is the denominator, rather than government expenditure. A large economy can spend more dollars while devoting a smaller proportion of its output to the military. Each allocation uses resources that have other possible uses; that observation alone does not establish an optimal budget.
What does NATO’s pledge mean?
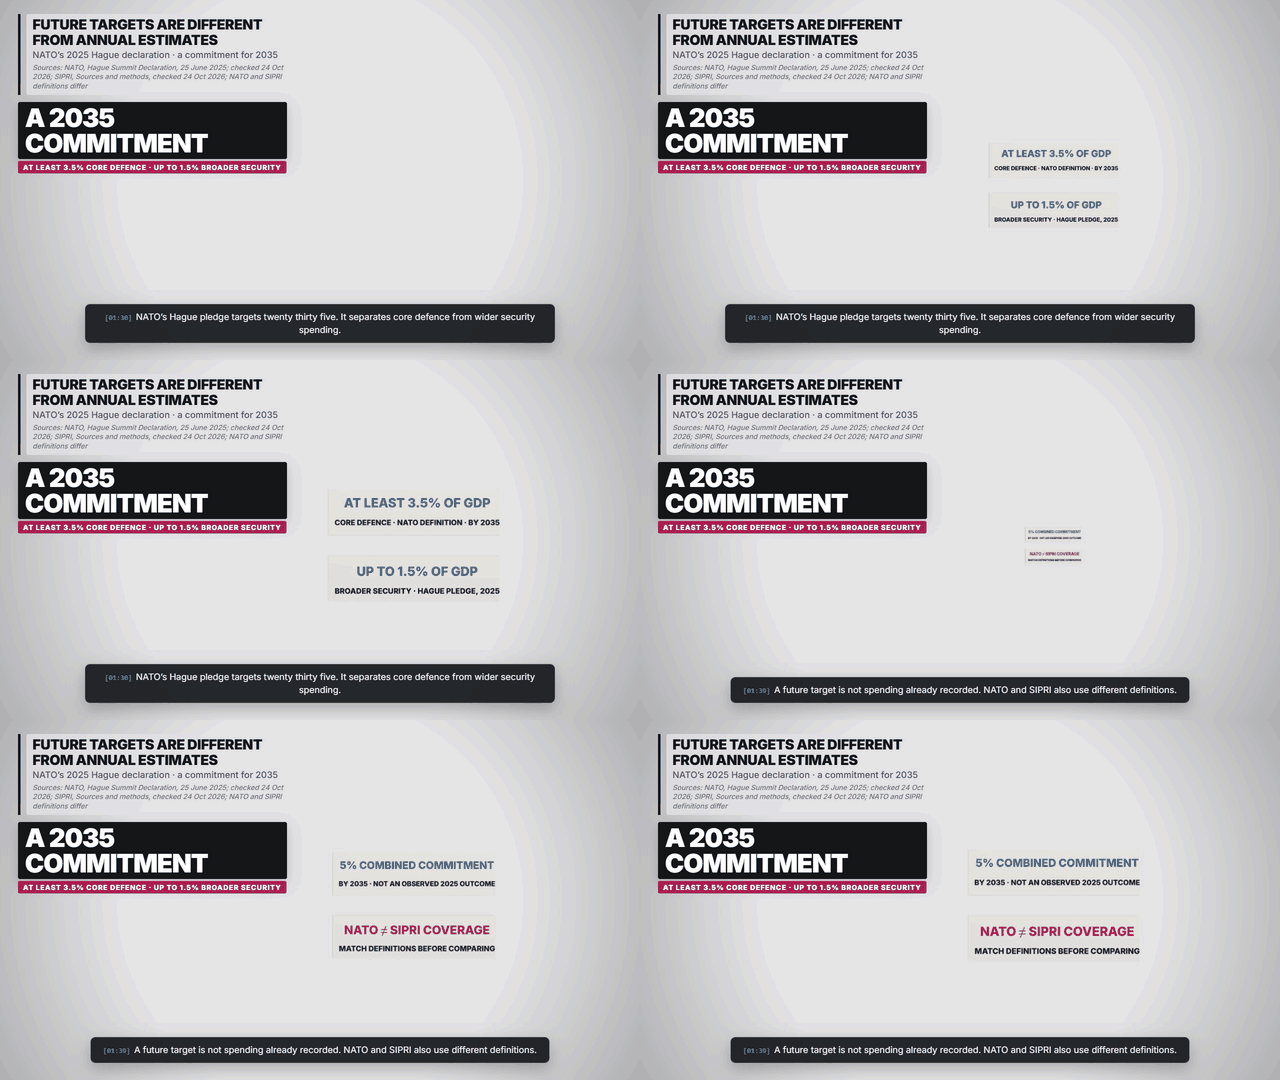
NATO: The Hague Summit Declaration, dated 25 June 2025, commits Allies to a combined 5% of GDP by 2035: at least 3.5% for core defence, under NATO’s definition, and up to 1.5% for broader security, including areas such as infrastructure, networks and resilience. Those conditions remain attached to the figures. The declaration also provides for a review in 2029.
A future commitment is different from expenditure already estimated for 2025. NATO and SIPRI use different coverage, so their figures cannot be swapped without checking definitions. The pledge is shown as labelled cards, rather than mixed into the annual spending charts.
Frequently asked questions
How much did the world spend on the military in 2025?
SIPRI estimates $2,887 billion in current US dollars, rounded here to $2.9 trillion. Its April 2026 release reports 2.9% growth after inflation and an eleventh consecutive annual increase. These are 2025 estimates, not a full-year 2026 total.
Which countries spent the most?
In SIPRI’s 2025 comparison, the United States spent $954 billion, China an estimated $336 billion and Russia an estimated $190 billion. Together they represented a rounded 51% of the world total. Dollars are converted at market exchange rates, not purchasing-power parity.
What does military burden mean?
Military burden is military spending divided by GDP. It is different from military spending divided by government expenditure. The selected 2025 estimates here are Ukraine at 40% of GDP, Russia at 7.5% and China at 1.7%.
Does military spending mean weapons purchases?
No. SIPRI’s coverage includes personnel, operations and maintenance, procurement, research and other military activities. Military aid is counted in donor expenditure; adding the same aid again can double count it.
Is NATO’s 5% pledge the same as recorded military spending?
No. The 25 June 2025 Hague declaration sets a combined commitment for 2035, covering at least 3.5% of GDP in core defence and up to 1.5% in broader security. It is a future target and NATO’s coverage differs from SIPRI’s.
Sources and reporting cutoff
- SIPRI: Trends in World Military Expenditure, 2025. April 2026 fact sheet, released 27 April. 2025 totals, growth, concentration and GDP shares. China, Russia and Ukraine figures include estimates.
- SIPRI: Global military spending release. 27 April 2026. Dollar totals and real changes; Europe includes Russia and Ukraine. Growth uses constant 2024 prices.
- SIPRI: Sources and methods. Coverage, military aid in donor spending, exchange-rate conversion, revisions and limits of cross-country comparisons. Checked 24 October 2026.
- SIPRI: Database coverage and update. Annual series currently through 2025; April 2026 edition. Current USD uses market exchange rates; constant-price basis is 2024. Checked 24 October 2026.
- NATO: The Hague Summit Declaration. 25 June 2025, paragraphs 2–3. A combined 5% of GDP commitment by 2035: at least 3.5% core defence and up to 1.5% broader security. A target, not a recorded 2025 outcome.
Research checked 24 October 2026. Annual estimates may change in later editions. No unreported full-year 2026 total, purchasing-power ranking or forecast is supplied. Recheck the sources before a later render.
▶ Explore the seven scenesCharts, maps and diagrams from the explainer