THE WORLD’S MILITARY BILL KEEPS RISING

2025 annual estimates · published April 2026 · checked 24 October 2026

$2.9 TRILLION
ESTIMATED GLOBAL MILITARY SPENDING · 2025 · ROUNDED
Transcript

Full transcript

The narration below matches the explainer. Its original reporting dates and qualifications still apply.

Read the companion article

THE WORLD’S MILITARY BILL KEEPS RISING
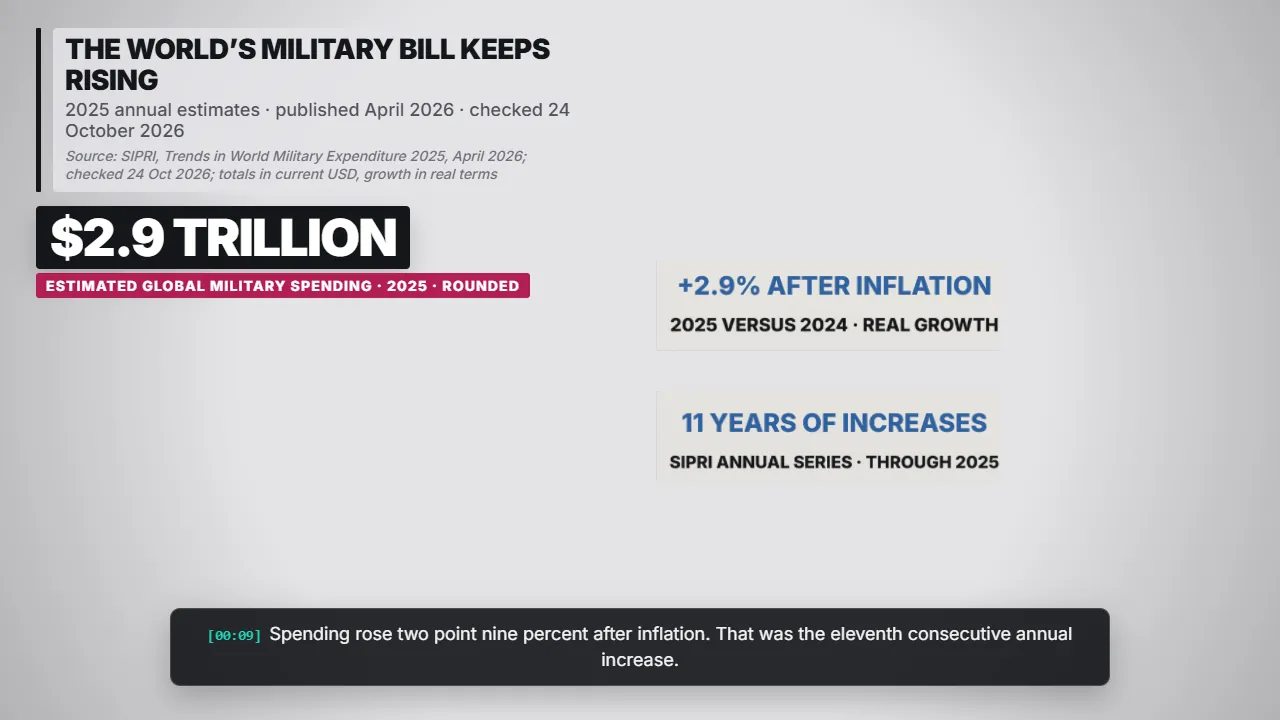
3D graphic: The world’s military bill keeps rising — $2.9 trillion. The world spent about two point nine trillion dollars on its militaries in twenty twenty five, SIPRI estimates.
The world’s military bill keeps rising — $2.9 trillion 2025 annual estimates · published April 2026 · checked 24 October 2026

The world spent about two point nine trillion dollars on its militaries in twenty twenty five, SIPRI estimates.

Spending rose two point nine percent after inflation. That was the eleventh consecutive annual increase.

MILITARY SPENDING COVERS MORE THAN WEAPONS
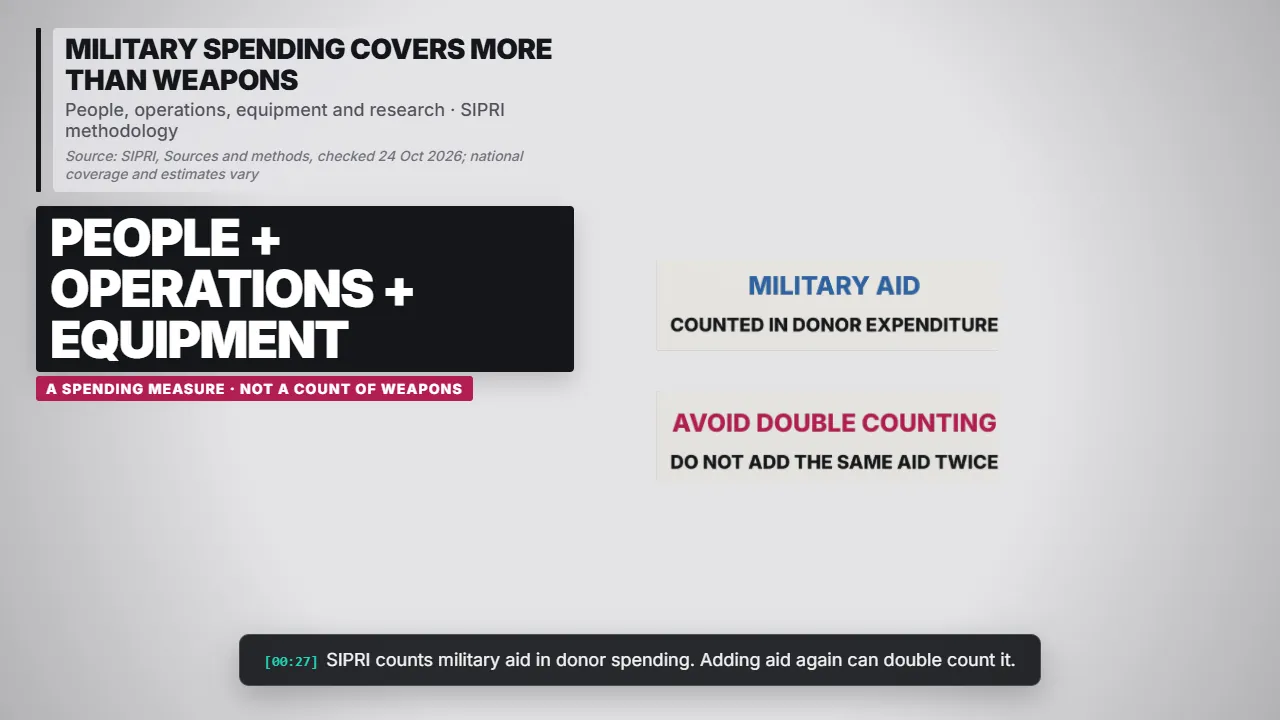
3D graphic: Military spending covers more than weapons — People + operations + equipment. The bill includes personnel, operations, equipment and research.
Military spending covers more than weapons — People + operations + equipment

The bill includes personnel, operations, equipment and research. It is broader than purchases of weapons.

SIPRI counts military aid in donor spending. Adding aid again can double count it.

THE UNITED STATES REMAINS THE BIGGEST SPENDER
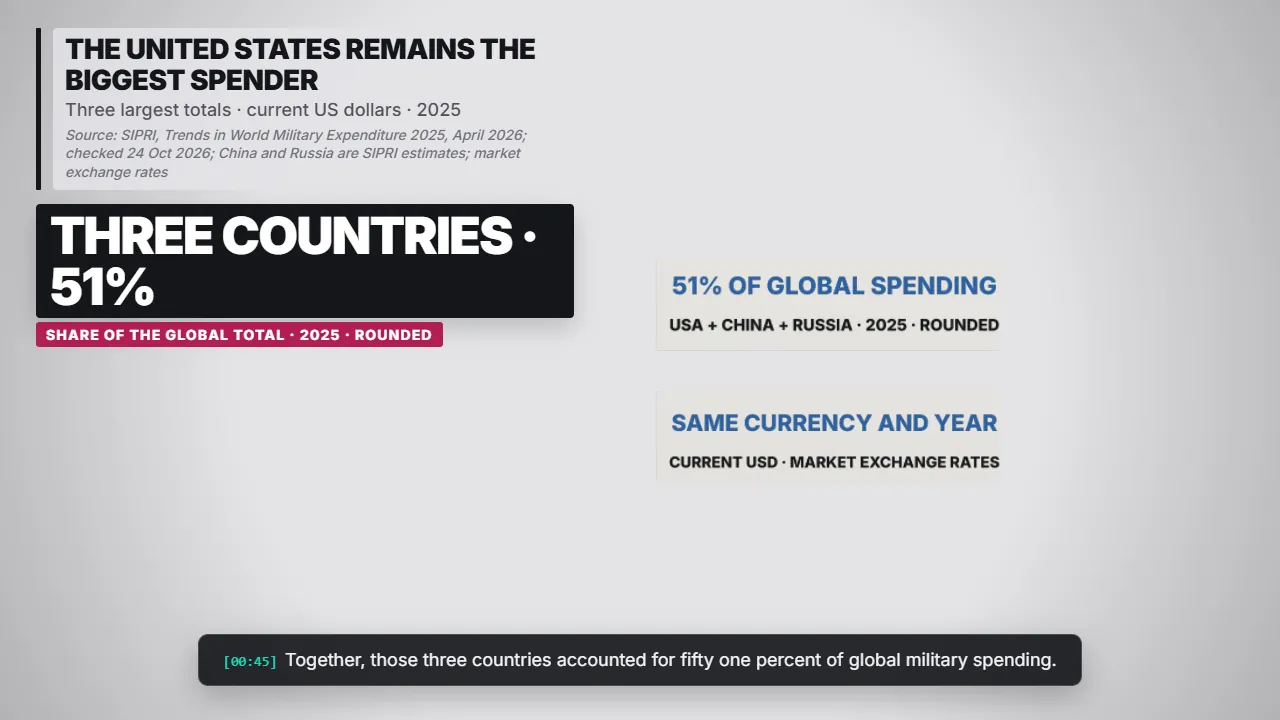
3D graphic: The united states remains the biggest spender — Three countries · 51%. America spent nine hundred fifty four billion dollars, the largest total.
The united states remains the biggest spender — Three countries · 51% Three largest totals · current US dollars · 2025

America spent nine hundred fifty four billion dollars, the largest total. China and Russia followed.

Together, those three countries accounted for fifty one percent of global military spending.

GLOBAL GROWTH HIDES DIFFERENT REGIONAL PATHS
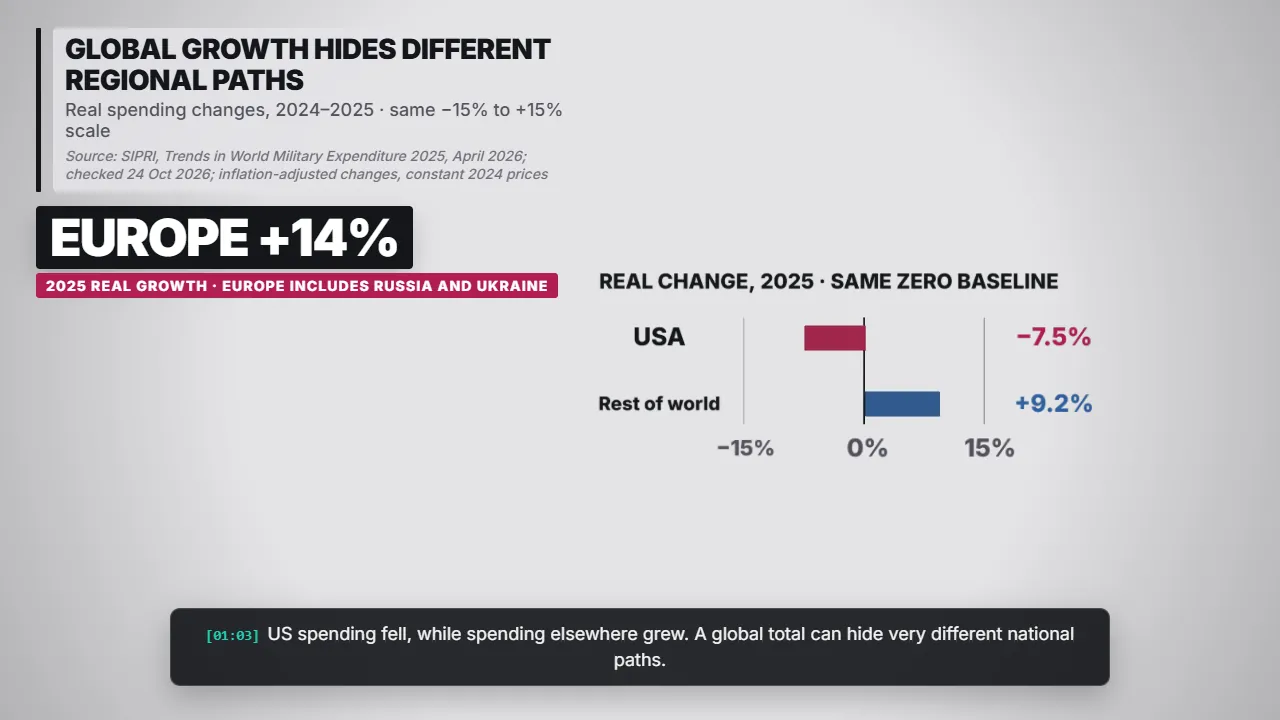
3D graphic: Global growth hides different regional paths — Europe +14%. Europe grew fastest among these regions.
Global growth hides different regional paths — Europe +14% Real spending changes, 2024–2025 · same −15% to +15% scale

Europe grew fastest among these regions. The Americas fell. This is a selected comparison, not every region.

US spending fell, while spending elsewhere grew. A global total can hide very different national paths.

DOLLAR RANKINGS AND ECONOMIC BURDEN DIFFER
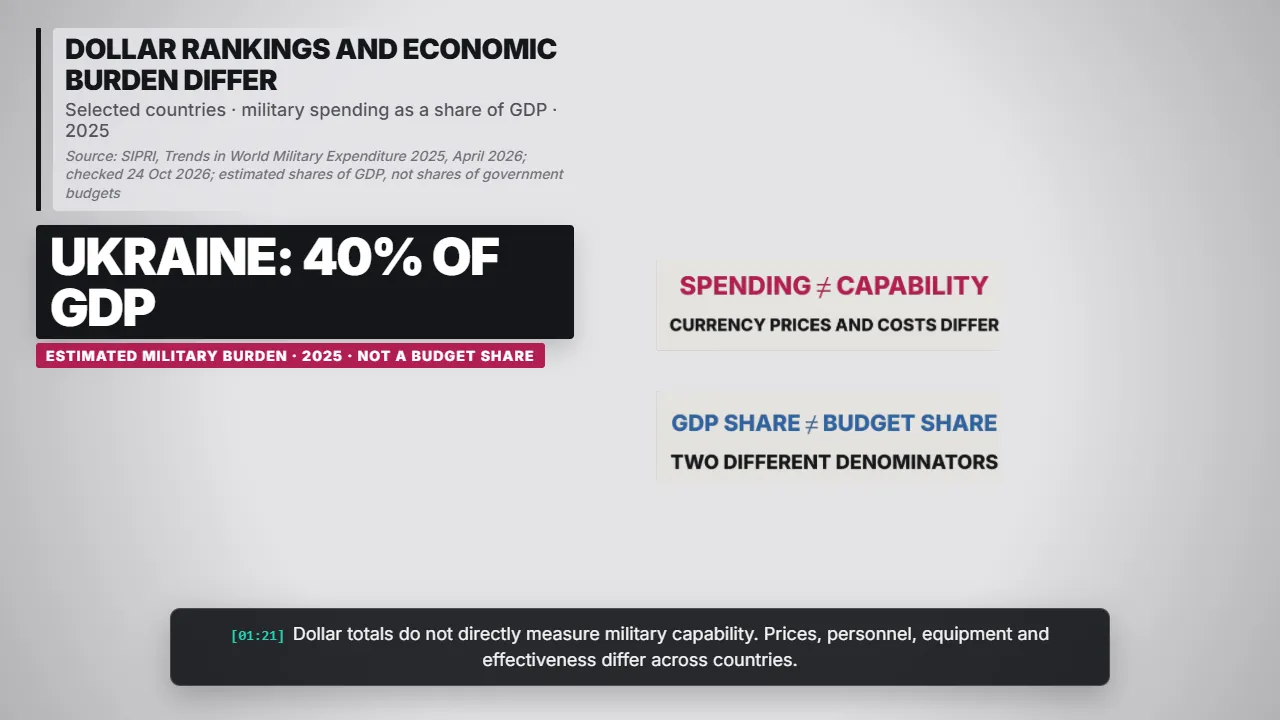
3D graphic: Dollar rankings and economic burden differ — Ukraine: 40% of GDP. Ukraine spent an estimated forty percent of its economy on the military.
Dollar rankings and economic burden differ — Ukraine: 40% of GDP Selected countries · military spending as a share of GDP · 2025

Ukraine spent an estimated forty percent of its economy on the military. GDP shares measure relative burden.

Dollar totals do not directly measure military capability. Prices, personnel, equipment and effectiveness differ across countries.

FUTURE TARGETS ARE DIFFERENT FROM ANNUAL ESTIMATES
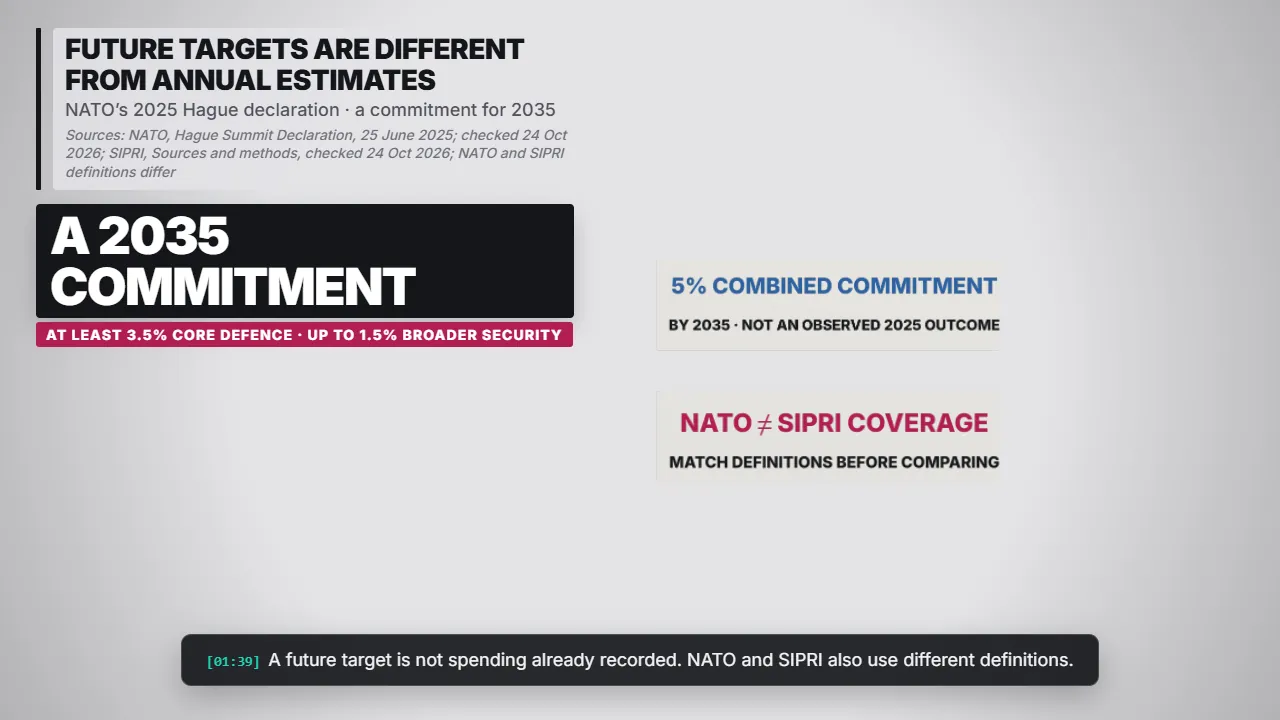
3D graphic: Future targets are different from annual estimates — A 2035 commitment. NATO’s Hague pledge targets twenty thirty five.
Future targets are different from annual estimates — A 2035 commitment NATO’s 2025 Hague declaration · a commitment for 2035

NATO’s Hague pledge targets twenty thirty five. It separates core defence from wider security spending.

A future target is not spending already recorded. NATO and SIPRI also use different definitions.

READ THE AMOUNT, THE BURDEN AND THE DEFINITION
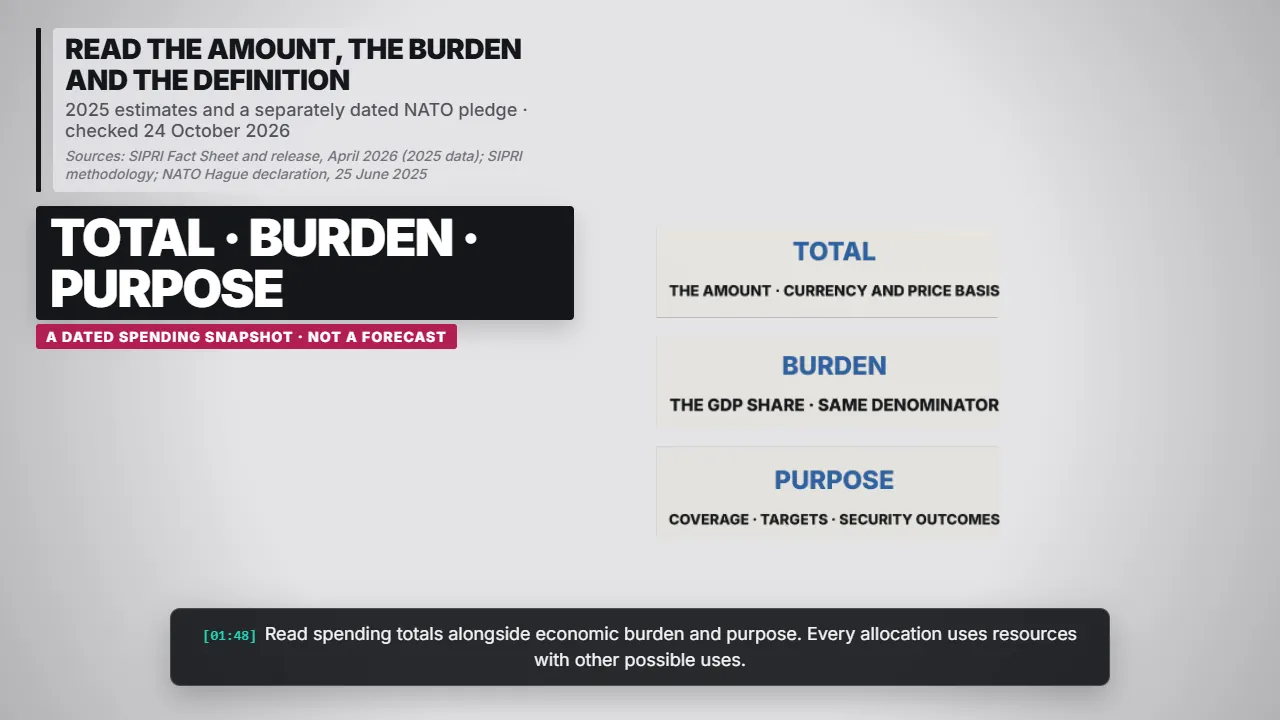
3D graphic: Read the amount, the burden and the definition — Total · Burden · Purpose. Read spending totals alongside economic burden and purpose.
Read the amount, the burden and the definition — Total · Burden · Purpose Sources: SIPRI Fact Sheet and release, April 2026 (2025 data); SIPRI methodology; NATO Hague declaration, 25 June 2025

Read spending totals alongside economic burden and purpose. Every allocation uses resources with other possible uses.

Check the dates and definitions in these sources. Estimates can change, and spending alone does not establish security outcomes.

Sources: SIPRI Fact Sheet and release, April 2026 (2025 data); SIPRI methodology; NATO Hague declaration, 25 June 2025

Source links

All Explainers
[00:00]
Read the full article

Military spending: brief and sources

Checked 24 October 2026. Latest complete SIPRI annual data: 2025, published April 2026. World total $2,887 billion current USD, rounded to $2.9 trillion; real growth +2.9%. Dollar comparisons use market exchange rates, not PPP. China/Russia totals and selected GDP shares are estimates. Regional chart shows selected regions only; Europe includes Russia and Ukraine. Growth charts share −15% to +15% axes; positive bars start at zero. GDP share is not government-budget share. NATO’s separately dated 2025 pledge concerns 2035 and uses different coverage. Estimates may be revised; spending does not measure capability or guarantee security.

SIPRI: Trends in World Military Expenditure, 2025 and SIPRI: Global military spending release provide the reported annual figures. SIPRI: Sources and methods and SIPRI: Database coverage and update explain coverage, units and revisions.

NATO: The Hague Summit Declaration supplies the separate future commitment. No future target is plotted alongside observed annual spending as if it had already happened.