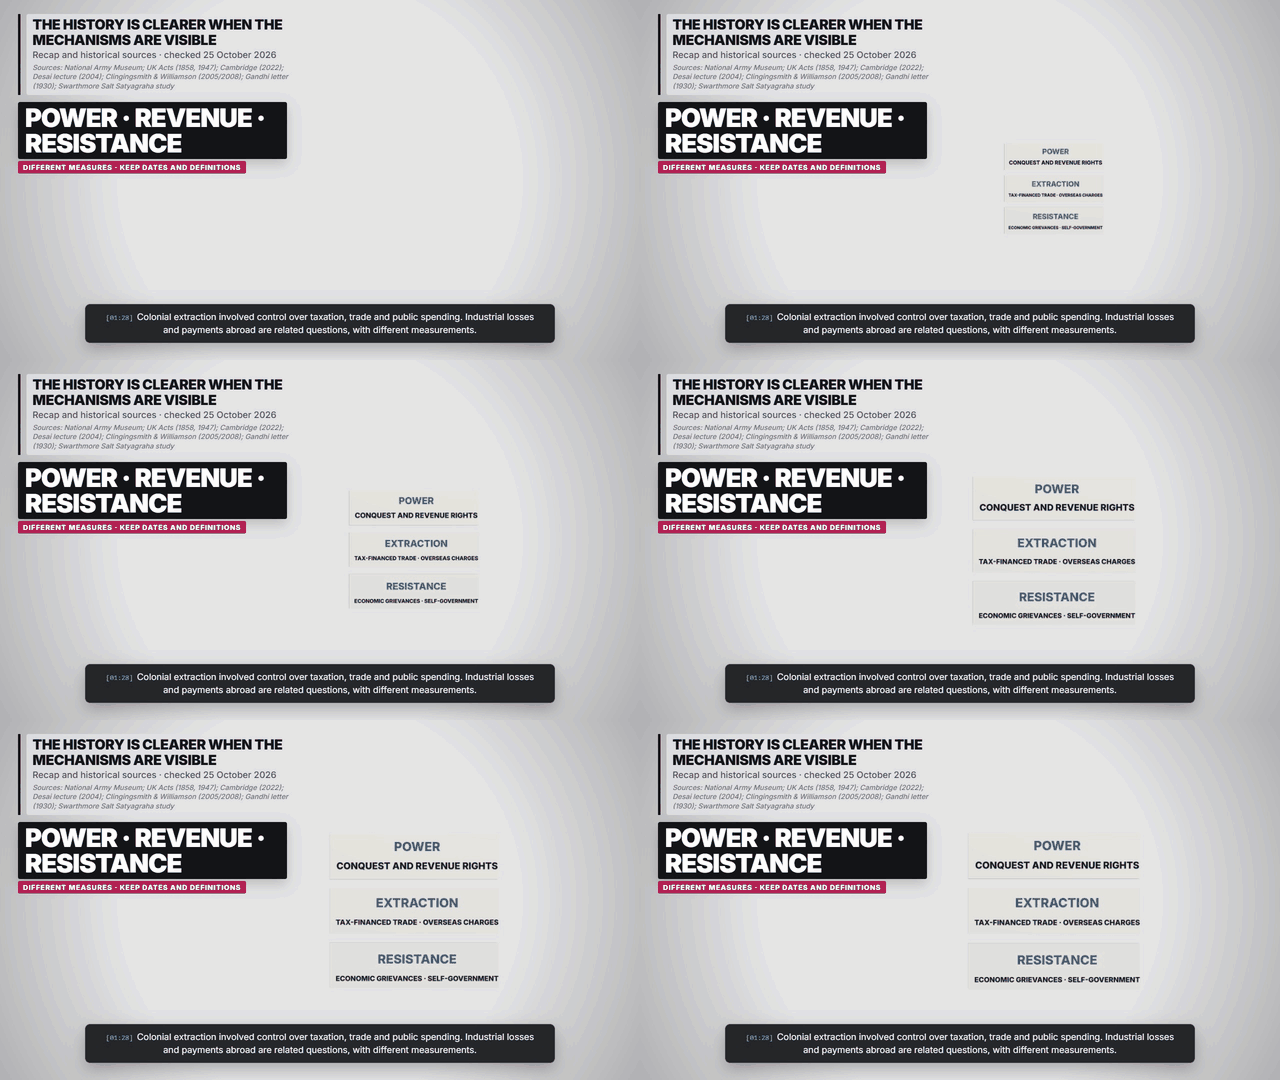
How Britain Took India’s Wealth
How British conquest, tax-financed trade and overseas charges extracted resources from India, with historical industrial estimates and the salt-tax resistance.
▶ Explore the narrated graphic explainerKey takeaways
- British extraction rested on military and political control, built over time rather than acquired in one act.
- Tax-financed export purchases and overseas budget charges help explain how resources could leave India.
- Industrial decline and the drain of wealth are related historical questions with different evidence and measurements.
- The salt campaign made an everyday economic grievance part of the struggle for self-government.
Dates, figures and definitions
| Period | Event or estimate | Scope | Source |
|---|---|---|---|
| 1765 | Bengal revenue rights | Company power to collect revenues, not the conquest of all India at once | National Army Museum: Armies of the East India Company |
| 1858 | Government transferred to the Crown | Different phase from Company administration | Government of India Act 1858 |
| 1947 | Independent India and Pakistan | Act dated 18 July; appointed day 15 August | Indian Independence Act 1947 |
| 1750 / 1900 | about 25% / about 2% | Historical India; shares of world industrial output; estimates, not GDP | Clingingsmith and Williamson: NBER Working Paper 11730 |
| 1930 | 12 March → 6 April | Sabarmati departure → salt-law defiance at Dandi | Swarthmore: Salt Satyagraha, 1930–1931 |
How did a company acquire the power to collect taxes?
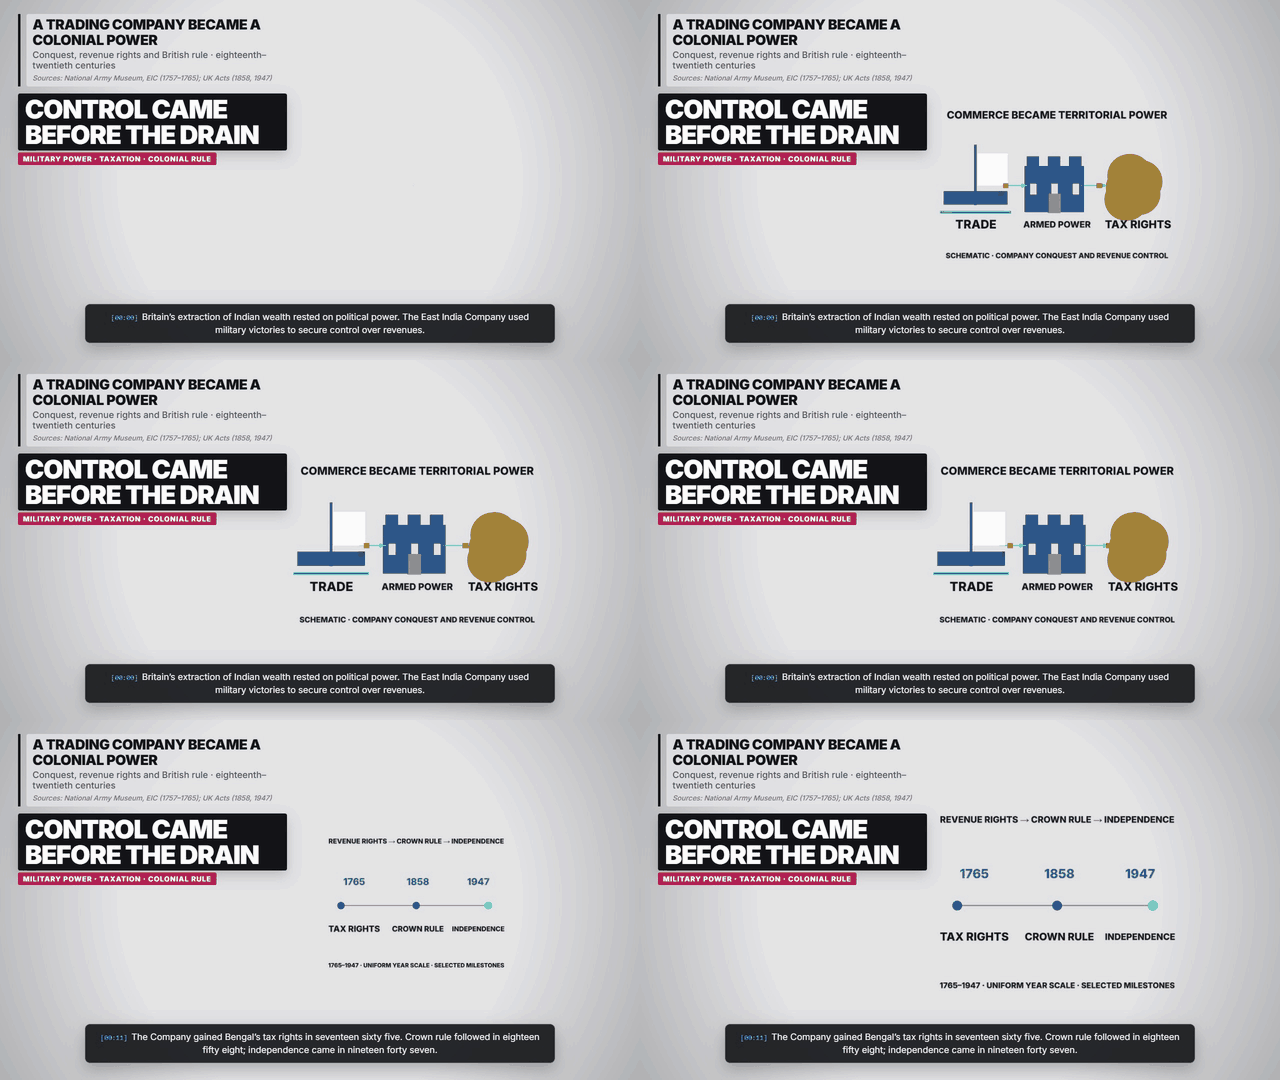
The East India Company began as a trading enterprise. Military force and interventions in Indian politics helped turn it into a territorial power. Its victories at Plassey in 1757 and Buxar in 1764 preceded the acquisition of Bengal revenue rights in 1765. The relationship between commerce and government had changed: a company could draw on taxes as well as trading receipts. Source: National Army Museum: Armies of the East India Company.
Its expansion was gradual and involved Indian allies, soldiers and rival powers. British India also coexisted with princely states under varying forms of supervision. In 1858 the British Parliament transferred the government of Company territories to the Crown. The separate 1947 Act provided for independent India and Pakistan. Sources: Government of India Act 1858; Indian Independence Act 1947.
What did the “drain of wealth” mean?
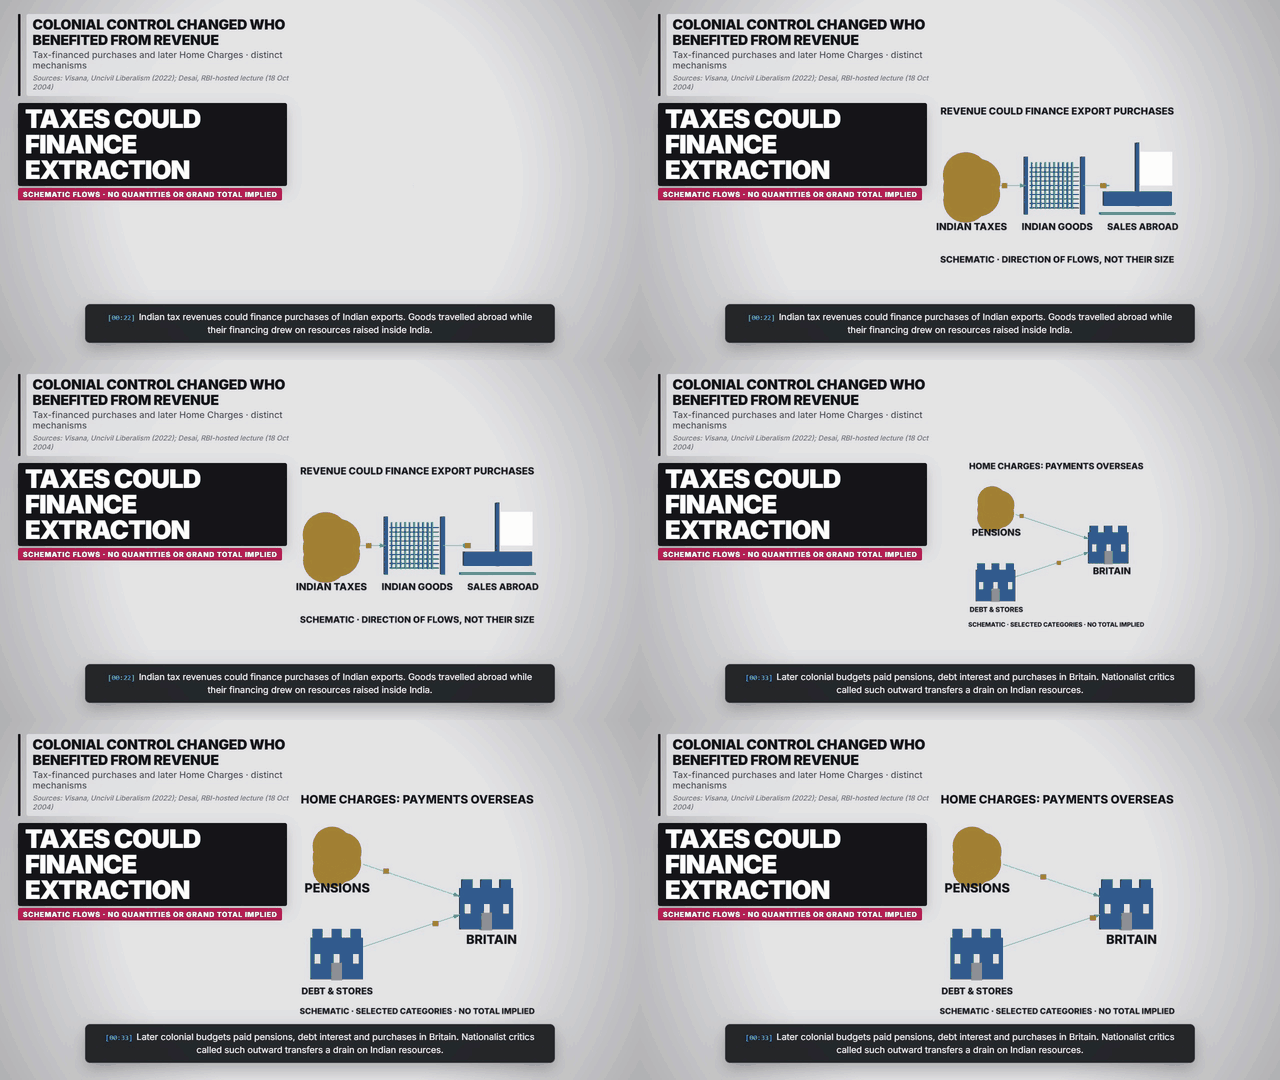
Dadabhai Naoroji argued that resources generated in India were being transferred abroad rather than retained for development. Vikram Visana’s account explains the council-bill mechanism: buyers obtained bills in London, Indian exporters received rupees in India, and part of that rupee funding came from land revenue. The key point is the connection between colonial taxation and export finance. Paying an exporter locally does not, by itself, reveal who ultimately financed the transaction or retained the overseas proceeds. Source: Vikram Visana: Conceptualizing the Drain Theory.
The animation compresses that relationship into taxes, Indian goods and sales abroad. Equal arrows and moving tokens show a direction and a mechanism. They do not establish the size of every payment or assert that every export used the same arrangement.
What were Home Charges?
Colonial budgets supported payments in Britain including pensions, interest and purchases of stores. These categories are identified in Meghnad Desai’s 2004 lecture hosted by the Reserve Bank of India. The lecture also questions parts of the nationalist interpretation. It should be read as a named scholar’s argument, rather than as an official RBI calculation of everything Britain took. Source: Meghnad Desai: Drains, Hoards and Foreigners, RBI-hosted lecture.
Some payments bought goods or services; critics disputed whether their scale, prices and purposes reflected Indian interests under foreign rule. Gross overseas payments and transfers without an equivalent return are therefore different accounting concepts. Establishing the categories is more useful than adding them indiscriminately into a single headline number.
What happened to Indian industry?
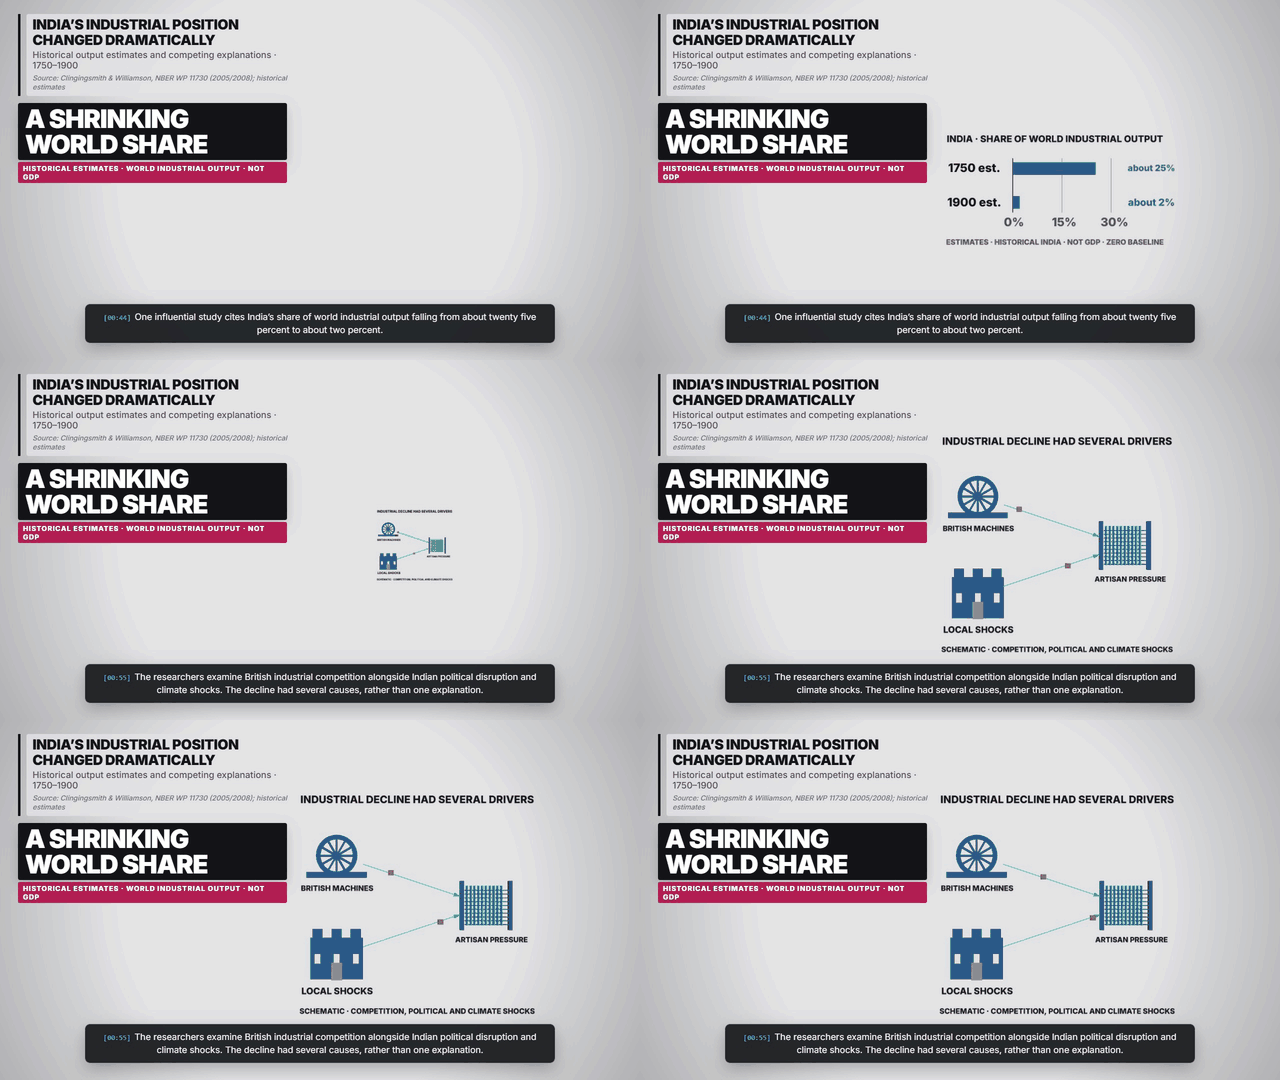
Clingingsmith and Williamson cite approximate shares of world industrial output of 25% in 1750 and 2% in 1900. These are historical reconstructions. The bars use the same zero baseline and denominator; they concern historical India, not today’s borders. A falling world share is not, on its own, a measurement of absolute output, GDP or money removed. Source: Clingingsmith and Williamson: NBER Working Paper 11730.
The researchers analyse British industrial ascent and international price competition alongside Indian political disruption and climate shocks. Trade policy also belongs in the history: Parliament describes the 1721 protection of British woollen producers against competing cotton cloth, including imports. These sources do not justify claiming that every Indian textile was always banned or that all industrial change had a single cause. Sources: Clingingsmith and Williamson: NBER Working Paper 11730; UK Parliament: The growth of textile manufacturing.
Why did salt become a symbol of resistance?
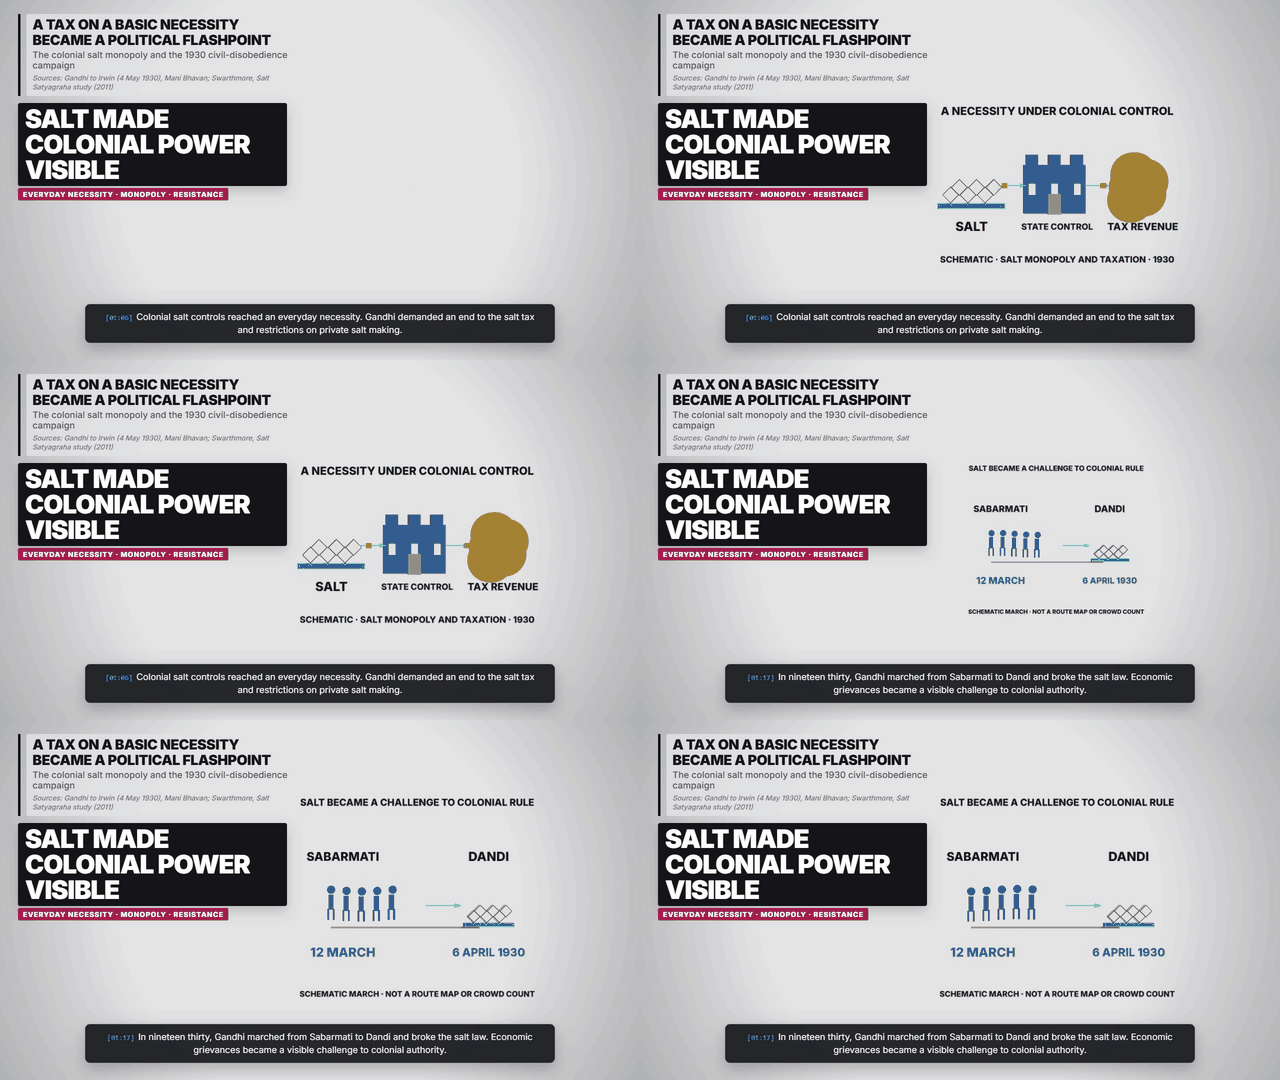
Colonial salt controls reached a basic necessity. In his letter of 4 May 1930, Gandhi demanded removal of the tax and restrictions on private salt making. His demand exposed the connection between an everyday commodity and the authority of the colonial government. Source: M. K. Gandhi: Letter to Lord Irwin, Mani Bhavan museum.
The Salt March began at Sabarmati on 12 March 1930. Gandhi broke the salt law at Dandi on 6 April. The campaign turned an economic grievance into public civil disobedience. The animation is a schematic illustration: its figures are not a crowd estimate and its path is not a geographic route. Source: Swarthmore: Salt Satyagraha, 1930–1931.
Can all the losses be expressed as one number?
The answer depends on the question. Payments recorded in historical accounts, changes in industrial production and income that might have existed under a different history are different measures. A calculation that compounds past sums also depends on a chosen return and valuation date. Those choices must be explicit before totals can be compared. The evidence of coercive extraction does not require treating every published estimate as the same kind of number.
Frequently asked questions
How did British rule extract resources from India?
Military and political control enabled revenue collection. Indian taxes could finance export purchases, while colonial budgets also supported payments in Britain. Different mechanisms operated at different times.
Was India’s industrial share really 25% and then 2%?
Clingingsmith and Williamson cite approximate estimates of world industrial output shares for 1750 and 1900. They are historical reconstructions with uncertain data, not modern GDP statistics or a direct measure of theft.
Did Britain alone cause every part of India’s industrial decline?
The cited researchers examine British industrial competition alongside Indian political fragmentation and climate shocks. Their analysis does not support treating every change as the result of a single cause.
How much wealth did Britain take in total?
A total depends on the period, geography, categories and valuation method. Recorded outward payments differ from estimates of lost growth or compounded returns. This page documents mechanisms without claiming one uncontested total.
Why was salt important to the independence movement?
Salt was an everyday necessity subject to colonial controls and taxation. Gandhi’s 1930 campaign linked that economic burden to a wider challenge to British political authority.
Does historical India mean today’s Indian borders?
No. British rule covered changing territories in the subcontinent and coexisted with princely states. The 1947 legislation established independent India and Pakistan; the chart concerns historical India.
Sources and historical scope
- National Army Museum: Armies of the East India Company. Historical events, 1600–1858. Company trading origins, military expansion, the 1757 and 1764 victories and the acquisition of Bengal revenue rights in 1765.
- Government of India Act 1858. 1858-08-02. Primary legislation transferring the government of Company territories to the Crown. No official document is recreated on screen.
- Indian Independence Act 1947. 1947-07-18. Primary legislation established independent India and Pakistan from 15 August 1947. Historical India is not identical to the present-day Republic of India.
- Vikram Visana: Conceptualizing the Drain Theory. 2022-09-27. Chapter in Uncivil Liberalism. Explains Naoroji’s argument and the role of Indian tax revenues in financing export purchases through the council-bill system.
- Meghnad Desai: Drains, Hoards and Foreigners, RBI-hosted lecture. 2004-10-18. Names pensions, debt interest and stores among Home Charges and critically discusses the drain thesis. A named scholar’s lecture hosted by RBI, not a modern central-bank estimate of total theft.
- Clingingsmith and Williamson: NBER Working Paper 11730. 2005-11; journal version 2008. Cites approximate historical shares of world industrial output: India 25% in 1750 and 2% in 1900. Studies British competition alongside local political and climate shocks; these are not GDP shares or a monetary drain total.
- UK Parliament: The growth of textile manufacturing. Historical legislation, 1721. Explains protection of the British woollen industry against domestic and imported cotton cloth. Not a claim that every Indian textile was always prohibited.
- M. K. Gandhi: Letter to Lord Irwin, Mani Bhavan museum. 1930-05-04. Primary letter demanding removal of the salt tax and restrictions on private salt making. Gandhi’s statements are attributed; no casualty or tax-rate claims are reproduced.
- Swarthmore: Salt Satyagraha, 1930–1931. 2011 case study; events in 1930–1931. University research case: the march began from Sabarmati on 12 March 1930; Gandhi broke the salt law at Dandi on 6 April. Animated walkers are schematic, not a crowd count or route map.
Historical explainer, sources checked 25 October 2026. British rule expanded over time; neither the Company nor the Crown controlled every part of the subcontinent in the same way. India’s approximately 25% (1750) and 2% (1900) shares are historical industrial-output estimates cited by Clingingsmith and Williamson, not GDP shares or amounts stolen. Tax-financed exports, Home Charges, industrial decline and counterfactual lost growth measure different things. The page supplies no single total for all colonial extraction. Equal arrows and moving tokens show mechanisms, not quantities. The Salt March illustration is not a geographic route or crowd estimate. Eight of ten slides are graphic; recap and sources are text.
▶ Explore the five scenesCharts, maps and diagrams from the explainer