South Korea: A Chip Boom, a Household Squeeze
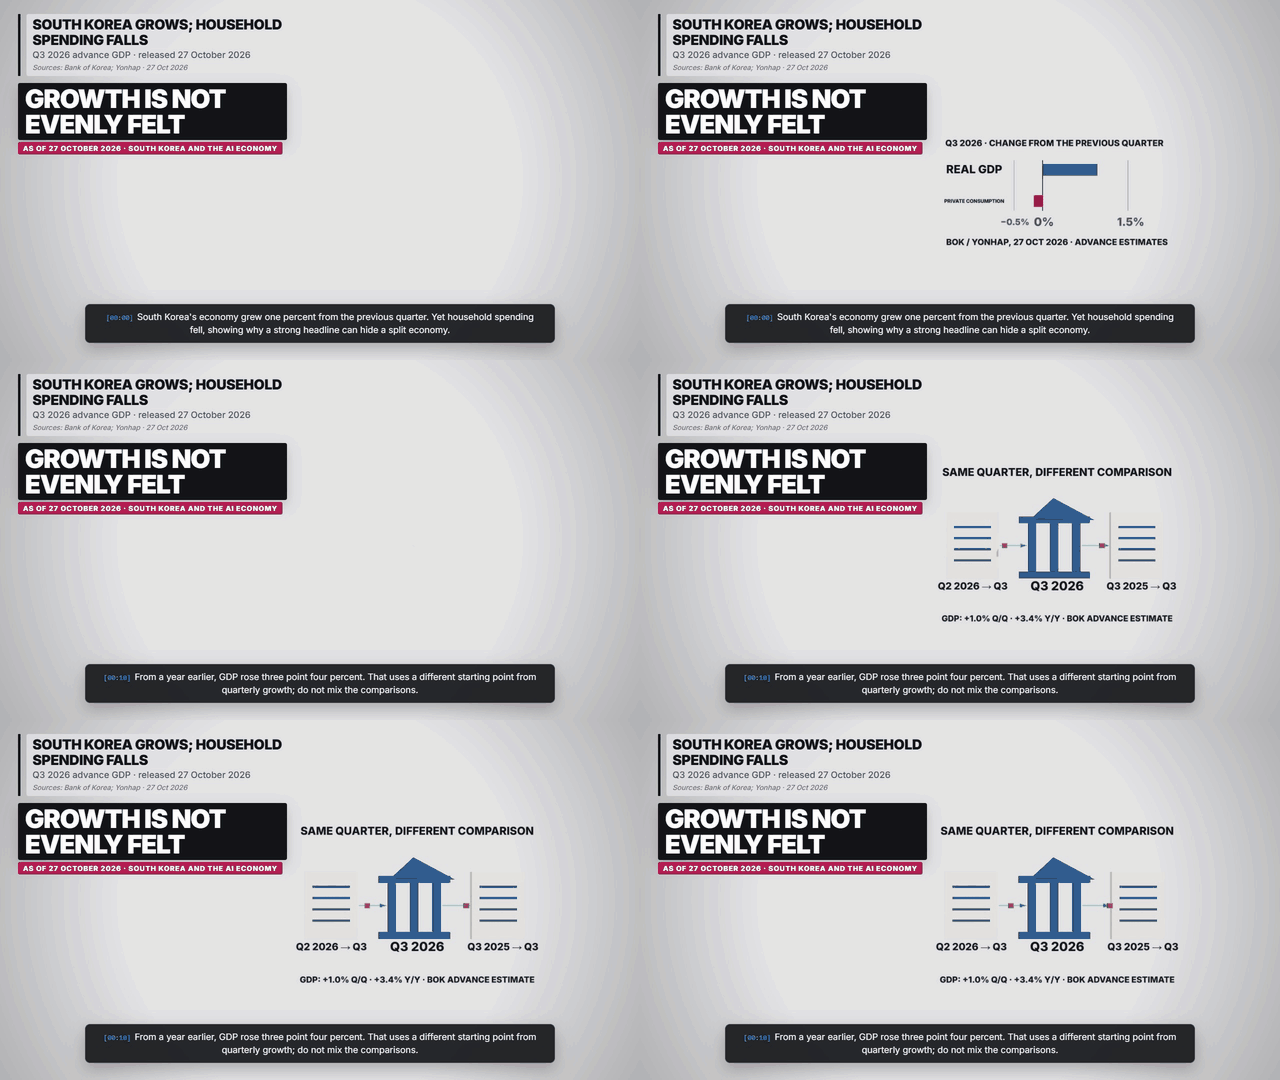
South Korea grew 1.0% quarter on quarter in Q3 2026, but private consumption fell. Advance GDP data explain the gap between chip-led growth and households.
Explore the interactive explainerKey takeaways
- Advance GDP rose 1.0% from Q2, with a different 3.4% year-on-year comparison.
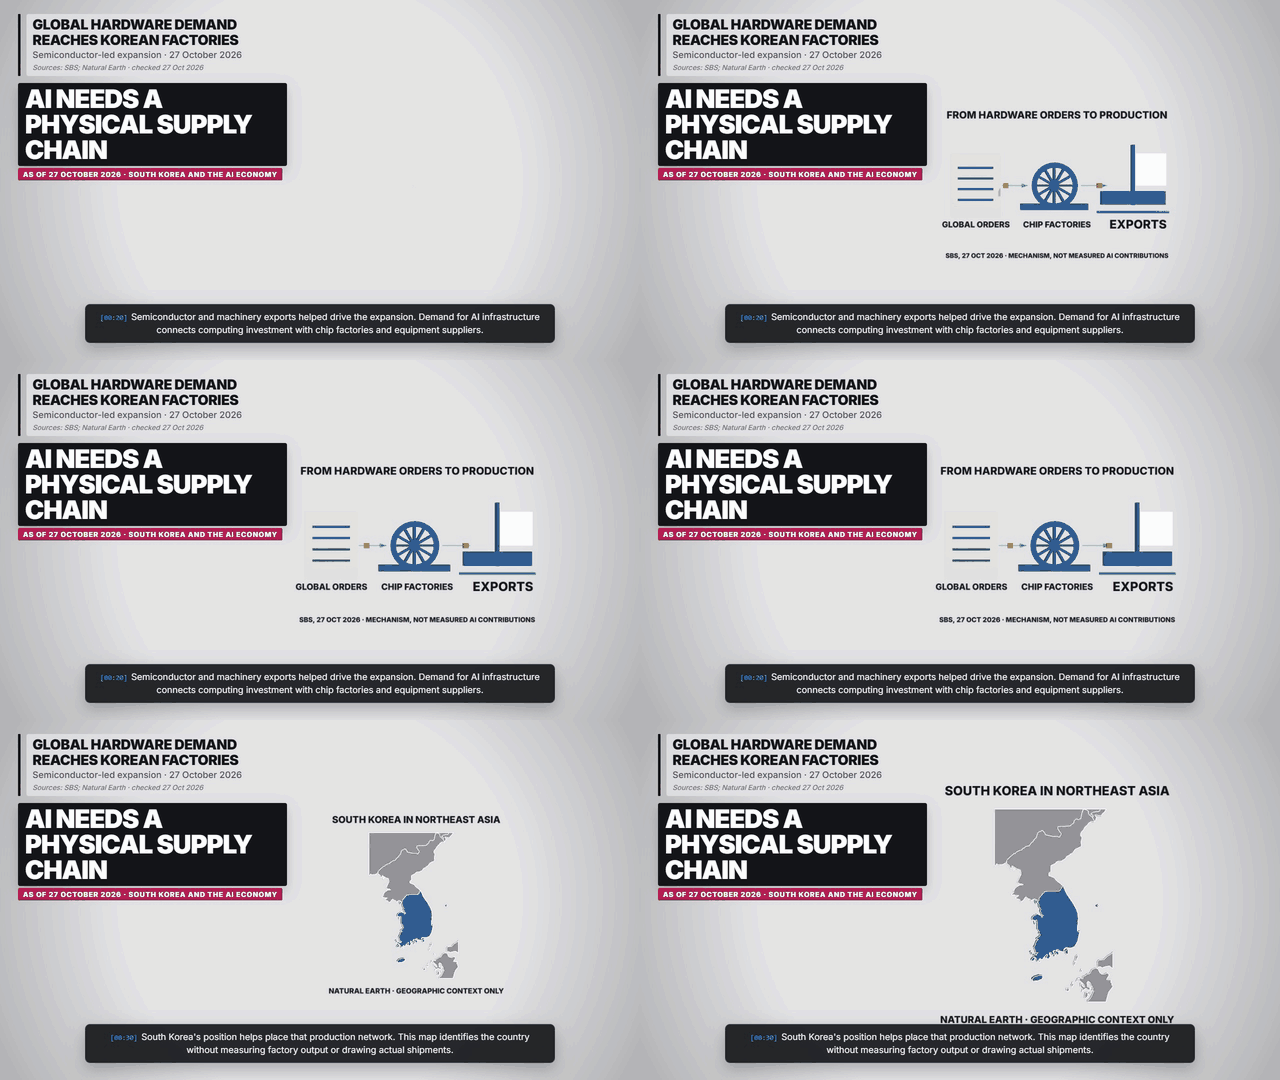
- Semiconductors and equipment investment helped drive growth.
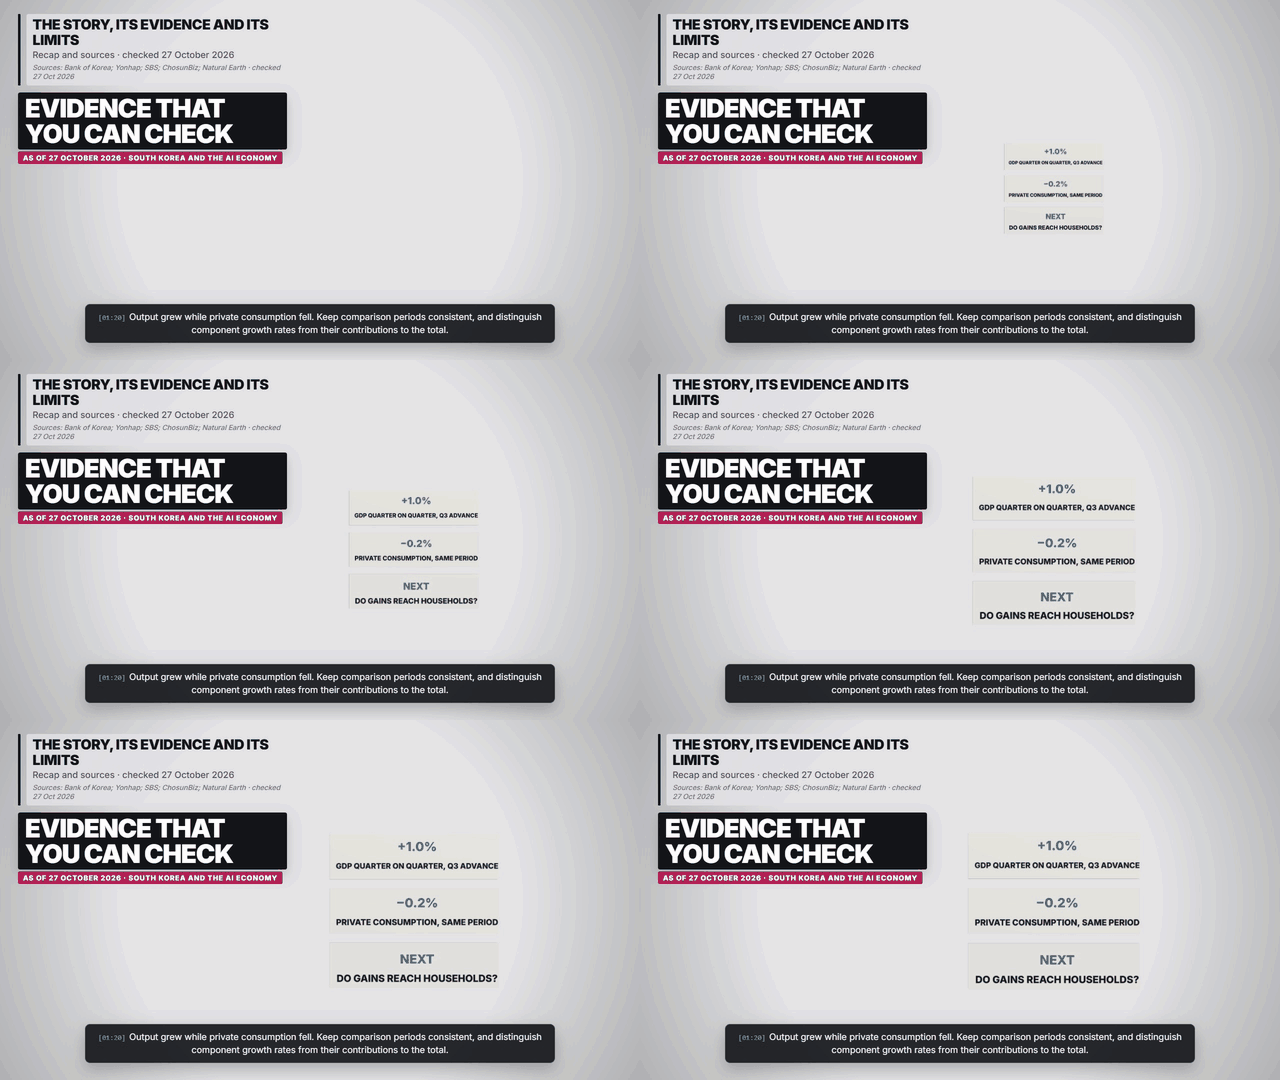
- Private consumption fell 0.2%, showing that headline growth and household demand diverge.
Sourced facts and figures
| Period | Fact or figure | Definition | Source |
|---|---|---|---|
| Q3 2026, advance | +1.0% | Real GDP, quarter on quarter | Bank of Korea: Q3 2026 advance GDP |
| Q3 2026, advance | +3.4% | Real GDP, year on year; different baseline | Bank of Korea: Q3 2026 advance GDP |
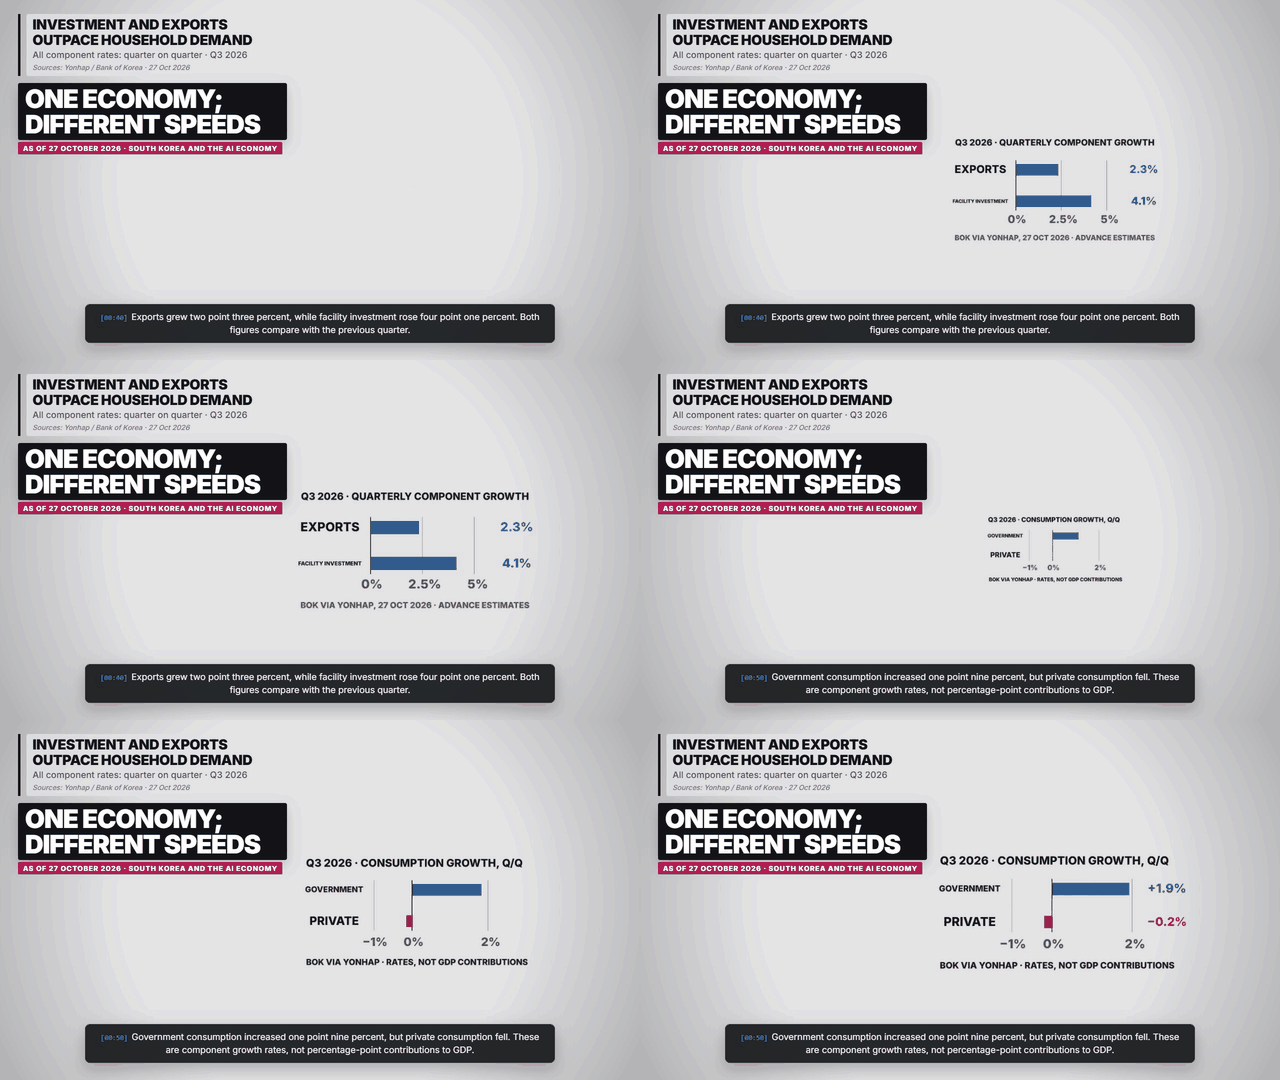
| Q3 2026, advance | +2.3%; +4.1% | Exports; facility investment, quarter on quarter | Yonhap: exports, investment and consumption |
| Q3 2026, advance | +1.9%; −0.2% | Government; private consumption, quarter on quarter | Yonhap: exports, investment and consumption |
What the release says
The Bank of Korea reported real GDP growth of 1.0% from the previous quarter and 3.4% from a year earlier. Both describe the July–September quarter, using different starting points. The release is an advance estimate and may be revised; neither rate is a promise about the next quarter. Source: Bank of Korea: Q3 2026 advance GDP.
Where the expansion came from
Yonhap reports exports rising 2.3% and facility investment 4.1% from the preceding quarter. Government consumption grew 1.9%, while private consumption fell 0.2%. The chart uses the same quarterly basis for each component. Their individual growth rates cannot be added to reconstruct GDP growth because the components have different weights and accounting roles. Source: Yonhap: exports, investment and consumption.
Why chips matter
SBS describes semiconductor and machinery exports as important drivers. AI infrastructure needs hardware as well as software, connecting overseas investment to Korean production. The diagram traces orders, manufacturing and exports. Equal arrows indicate a mechanism rather than equal spending or a measured contribution from AI alone. Source: SBS: semiconductor-led growth.
Why households can feel a different economy
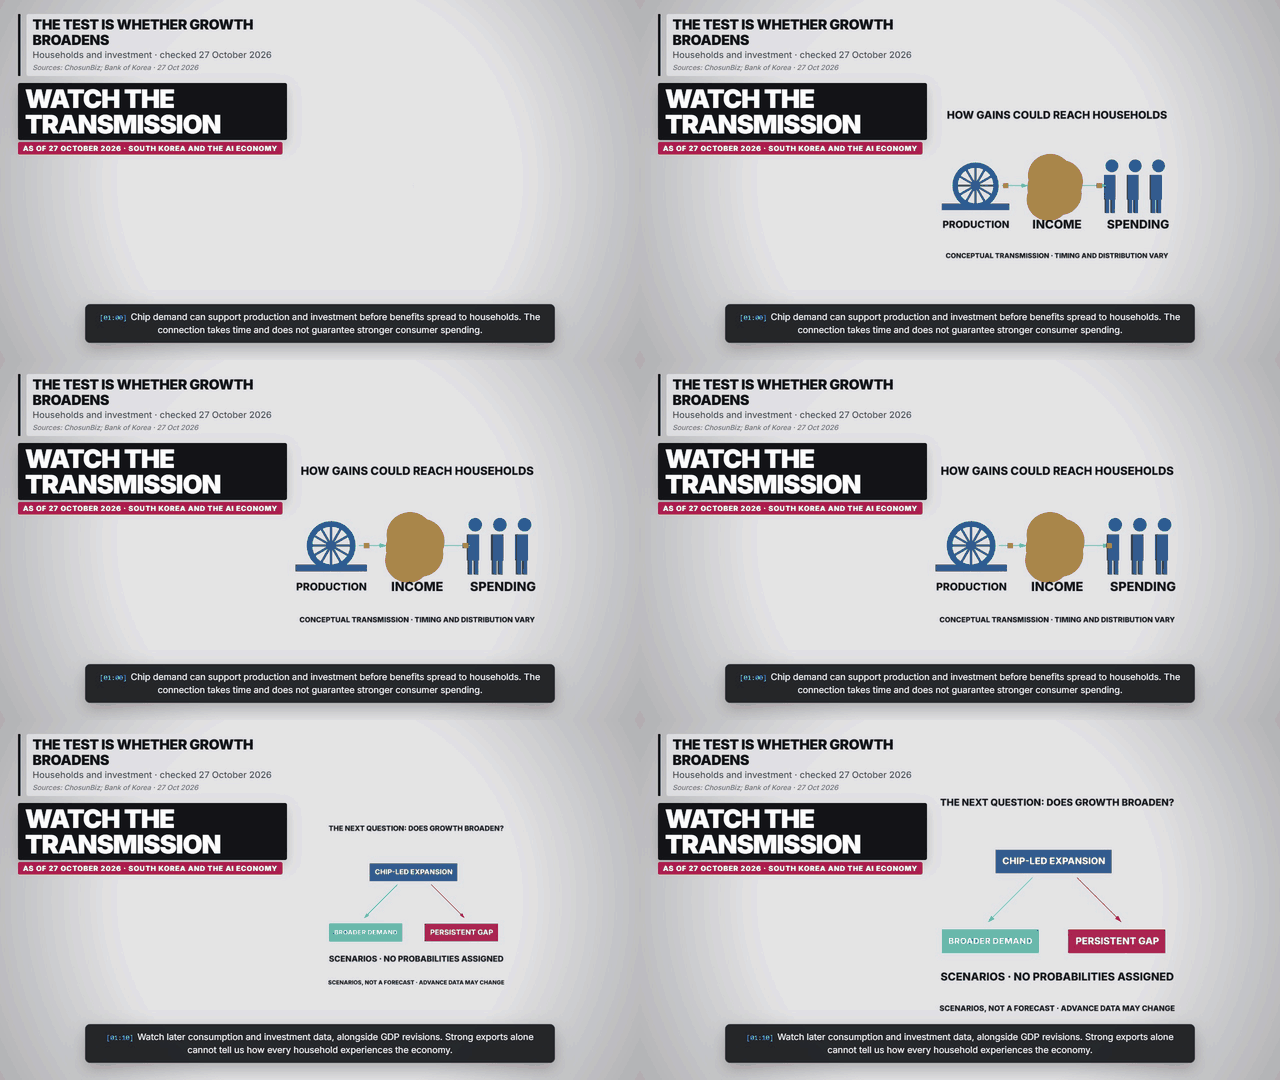
ChosunBiz highlights the gap between chip-led output and private consumption. Aggregate gains can coexist with cautious spending when income, timing and conditions differ across households. It takes subsequent data to establish whether the expansion broadens. This snapshot does not assume that stronger exports will automatically produce a consumer recovery. Source: ChosunBiz: household spending diverges.
Frequently asked questions
Is 3.4% an annualised quarterly rate?
No. It compares Q3 2026 with Q3 2025; 1.0% compares Q3 with Q2 2026.
Can the component percentages be added?
No. They are growth rates for differently weighted components, not percentage-point contributions.
Did household consumption grow?
Private consumption fell 0.2% from the previous quarter in the advance data.
Charts, maps and diagrams from the explainer
Sources and reporting scope
- Bank of Korea: Q3 2026 advance GDP. 2026-10-27. Real GDP +1.0% quarter on quarter and +3.4% year on year. Advance estimate, subject to revision.
- Yonhap: exports, investment and consumption. 2026-10-27. Reports BOK component rates: exports +2.3%, facility investment +4.1%, government consumption +1.9%, private consumption −0.2%, all quarter on quarter.
- SBS: semiconductor-led growth. 2026-10-27. Reports semiconductor and machinery exports behind the quarterly expansion; compares with BOK August forecast.
- ChosunBiz: household spending diverges. 2026-10-27. Reports weaker private consumption despite chip exports and facility investment. Growth rates do not imply identical household experience.
- Natural Earth: country boundaries. v5.1.2; generated 27 Oct 2026. One projection per map; neighbouring countries clipped at frame edges. Geography only; no territorial endorsement or live movements.
Checked 27 October 2026, 14:45 UTC. Bank of Korea advance estimates released 27 October, subject to revision. GDP quarter-on-quarter and year-on-year rates are different comparisons. Component growth rates are not contributions to GDP. Diagrams show mechanisms, not measured trade volumes or stock recommendations.
Explore the five scenes