SOUTH KOREA GROWS; HOUSEHOLD SPENDING FALLS
Q3 2026 advance GDP · released 27 October 2026

GROWTH IS NOT EVENLY FELT
AS OF 27 OCTOBER 2026 · SOUTH KOREA AND THE AI ECONOMY
Transcript

Full transcript

The narration below matches the explainer. Its original reporting dates and qualifications still apply.

Read the companion article

SOUTH KOREA GROWS; HOUSEHOLD SPENDING FALLS

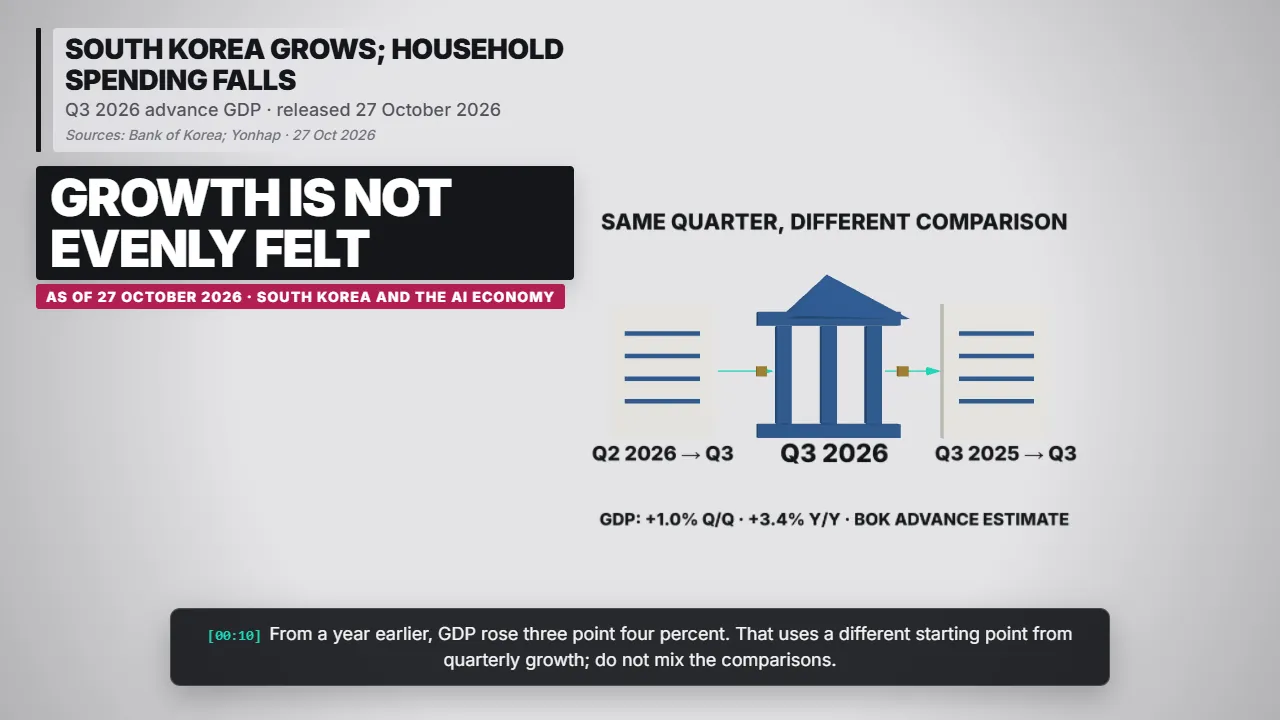
Change chart: South korea grows; household spending falls — Growth is not evenly felt. South Korea's economy grew one percent from the previous quarter.
South korea grows; household spending falls — Growth is not evenly felt Sources: Bank of Korea; Yonhap · 27 Oct 2026

South Korea's economy grew one percent from the previous quarter. Yet household spending fell, showing why a strong headline can hide a split economy.

From a year earlier, GDP rose three point four percent. That uses a different starting point from quarterly growth; do not mix the comparisons.

Sources: Bank of Korea; Yonhap · 27 Oct 2026

GLOBAL HARDWARE DEMAND REACHES KOREAN FACTORIES
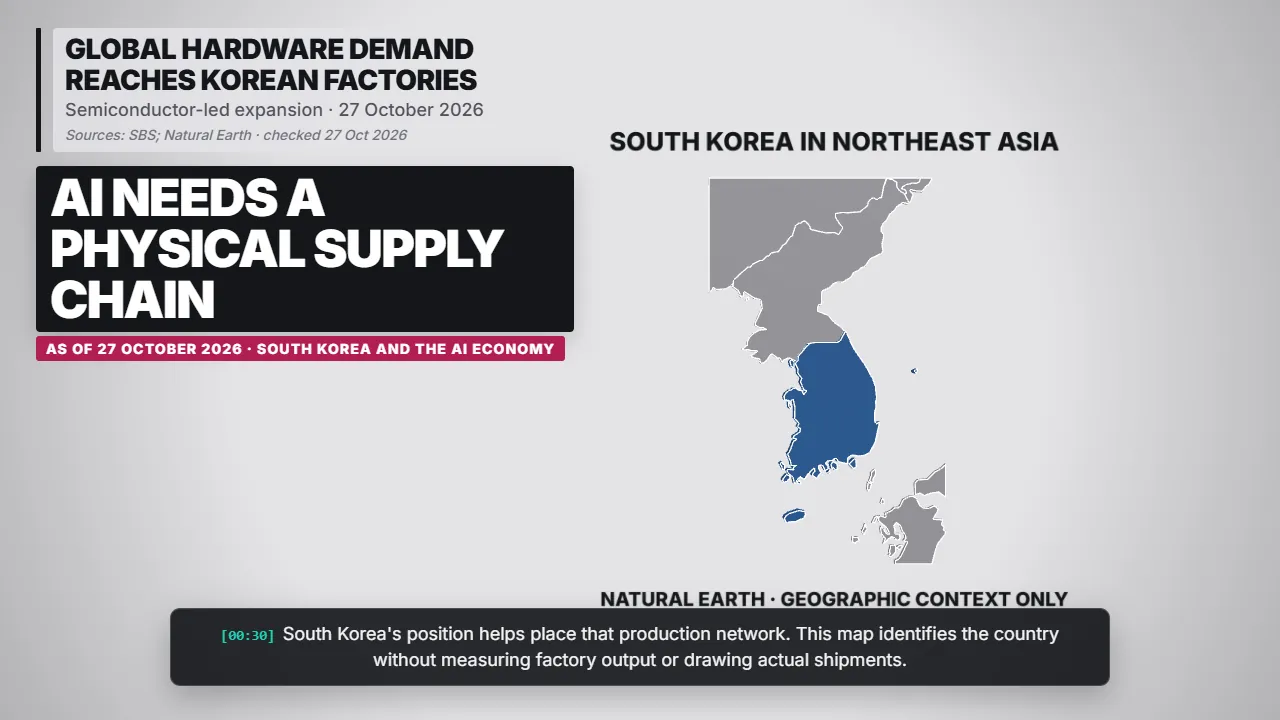
Flow diagram: Global hardware demand reaches korean factories — AI needs a physical supply chain. Semiconductor and machinery exports helped drive the expansion.
Global hardware demand reaches korean factories — AI needs a physical supply chain Sources: SBS; Natural Earth · checked 27 Oct 2026

Semiconductor and machinery exports helped drive the expansion. Demand for AI infrastructure connects computing investment with chip factories and equipment suppliers.

South Korea's position helps place that production network. This map identifies the country without measuring factory output or drawing actual shipments.

Sources: SBS; Natural Earth · checked 27 Oct 2026

INVESTMENT AND EXPORTS OUTPACE HOUSEHOLD DEMAND
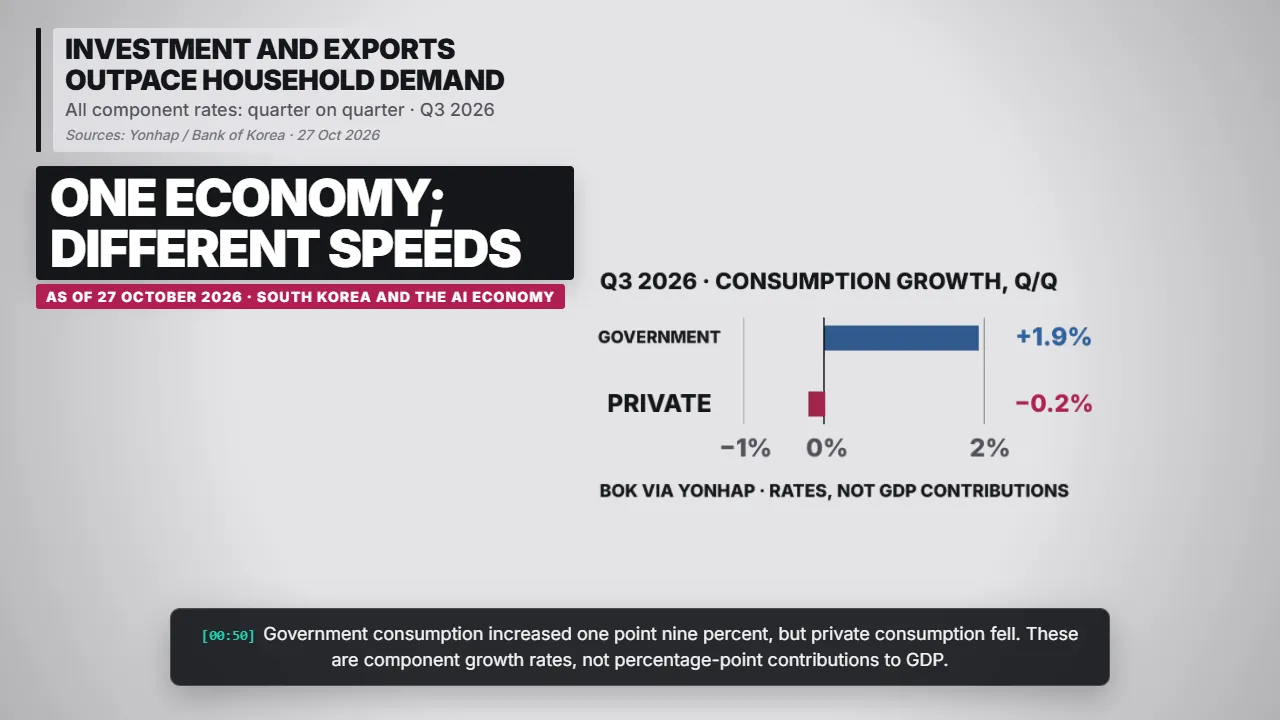
Bar chart: Investment and exports outpace household demand — One economy; different speeds. Exports grew two point three percent, while facility investment rose four point one percent.
Investment and exports outpace household demand — One economy; different speeds Sources: Yonhap / Bank of Korea · 27 Oct 2026

Exports grew two point three percent, while facility investment rose four point one percent. Both figures compare with the previous quarter.

Government consumption increased one point nine percent, but private consumption fell. These are component growth rates, not percentage-point contributions to GDP.

Sources: Yonhap / Bank of Korea · 27 Oct 2026

THE TEST IS WHETHER GROWTH BROADENS
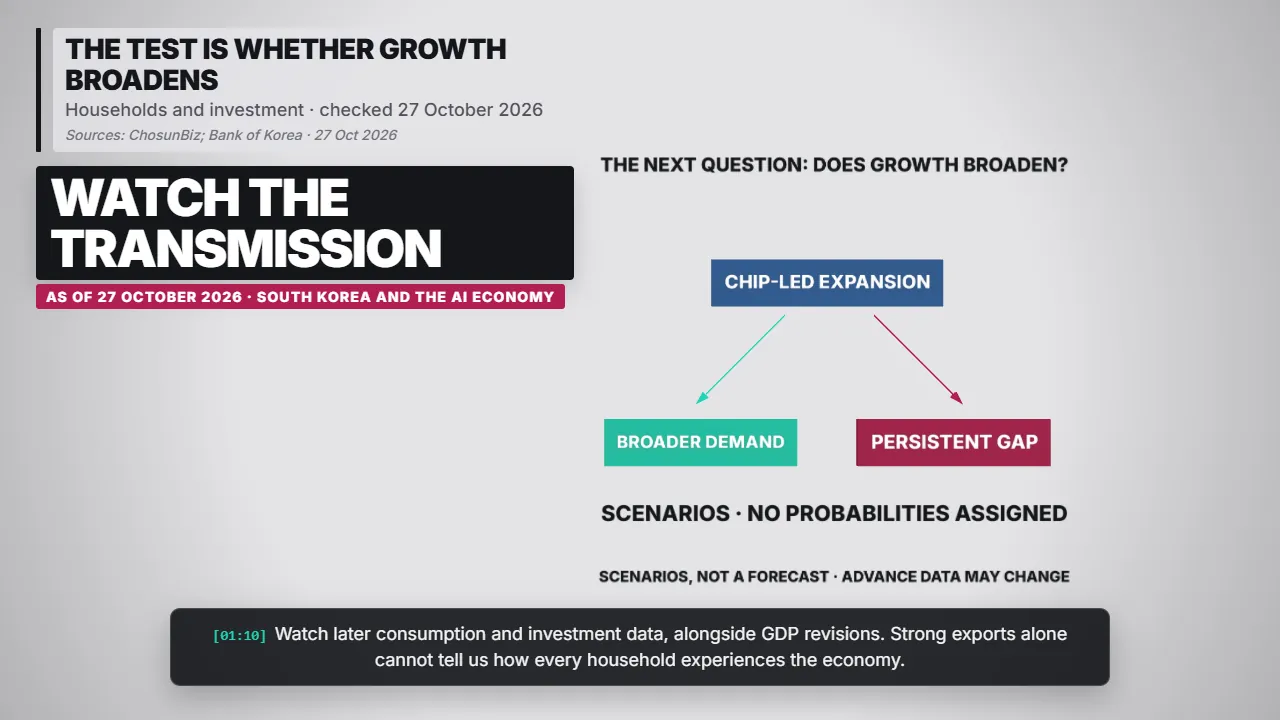
Flow diagram: The test is whether growth broadens — Watch the transmission. Chip demand can support production and investment before benefits spread to households.
The test is whether growth broadens — Watch the transmission Sources: ChosunBiz; Bank of Korea · 27 Oct 2026

Chip demand can support production and investment before benefits spread to households. The connection takes time and does not guarantee stronger consumer spending.

Watch later consumption and investment data, alongside GDP revisions. Strong exports alone cannot tell us how every household experiences the economy.

Sources: ChosunBiz; Bank of Korea · 27 Oct 2026

THE STORY, ITS EVIDENCE AND ITS LIMITS
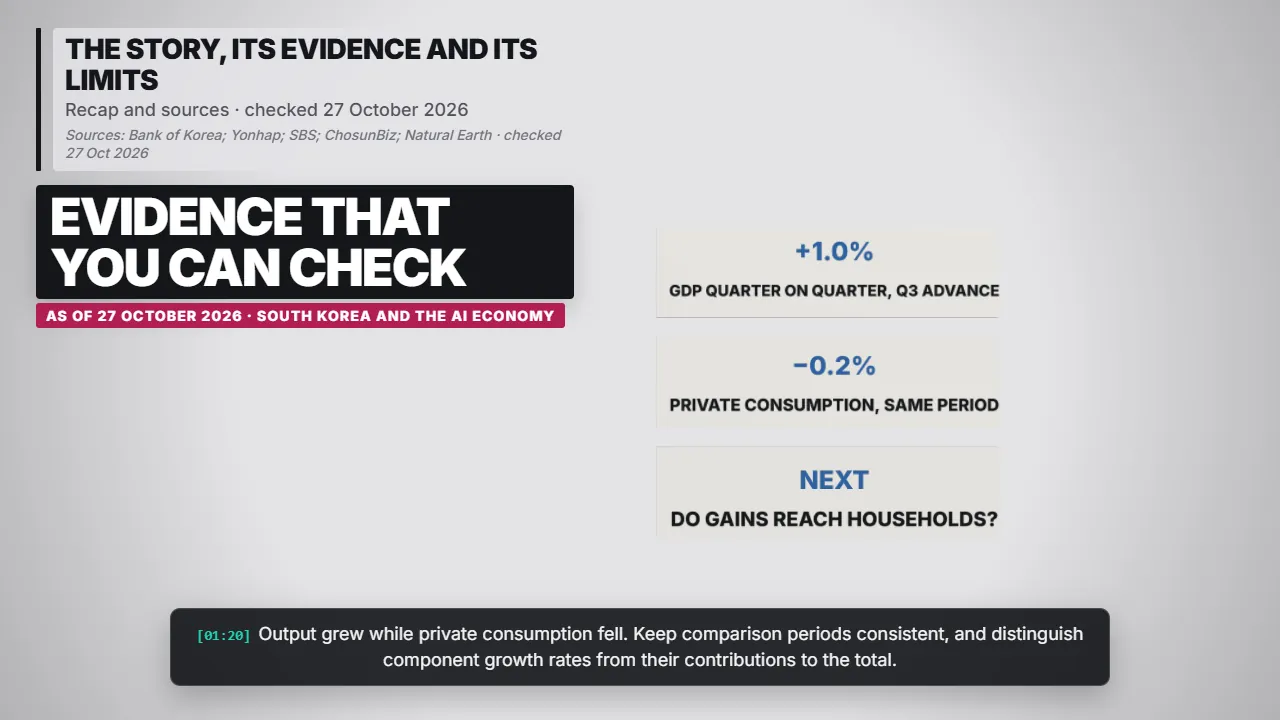
3D graphic: The story, its evidence and its limits — Evidence that you can check. Output grew while private consumption fell.
The story, its evidence and its limits — Evidence that you can check Sources: Bank of Korea; Yonhap; SBS; ChosunBiz; Natural Earth · checked 27 Oct 2026

Output grew while private consumption fell. Keep comparison periods consistent, and distinguish component growth rates from their contributions to the total.

These sources preserve the dates and qualifications behind the story. This is a checked snapshot; later developments can change the picture.

Sources: Bank of Korea; Yonhap; SBS; ChosunBiz; Natural Earth · checked 27 Oct 2026

Source links

All Explainers
[00:00]
Read the full article

South Korea: A Chip Boom, a Household Squeeze: brief and sources

Checked 27 October 2026, 14:45 UTC. Bank of Korea advance estimates released 27 October, subject to revision. GDP quarter-on-quarter and year-on-year rates are different comparisons. Component growth rates are not contributions to GDP. Diagrams show mechanisms, not measured trade volumes or stock recommendations.

Bank of Korea: Q3 2026 advance GDP. 2026-10-27. Real GDP +1.0% quarter on quarter and +3.4% year on year. Advance estimate, subject to revision.

Yonhap: exports, investment and consumption. 2026-10-27. Reports BOK component rates: exports +2.3%, facility investment +4.1%, government consumption +1.9%, private consumption −0.2%, all quarter on quarter.

SBS: semiconductor-led growth. 2026-10-27. Reports semiconductor and machinery exports behind the quarterly expansion; compares with BOK August forecast.

ChosunBiz: household spending diverges. 2026-10-27. Reports weaker private consumption despite chip exports and facility investment. Growth rates do not imply identical household experience.

Natural Earth: country boundaries. v5.1.2; generated 27 Oct 2026. One projection per map; neighbouring countries clipped at frame edges. Geography only; no territorial endorsement or live movements.