Producer prices up 6.5% in a year

Annual rate · As of 14 November 2026

6.5% in a year
AS OF 14 NOVEMBER 2026 · DATED SOURCES
Transcript

Full transcript

The narration below matches the explainer. Its original reporting dates and qualifications still apply.

Read the companion article

Producer prices up 6.5% in a year

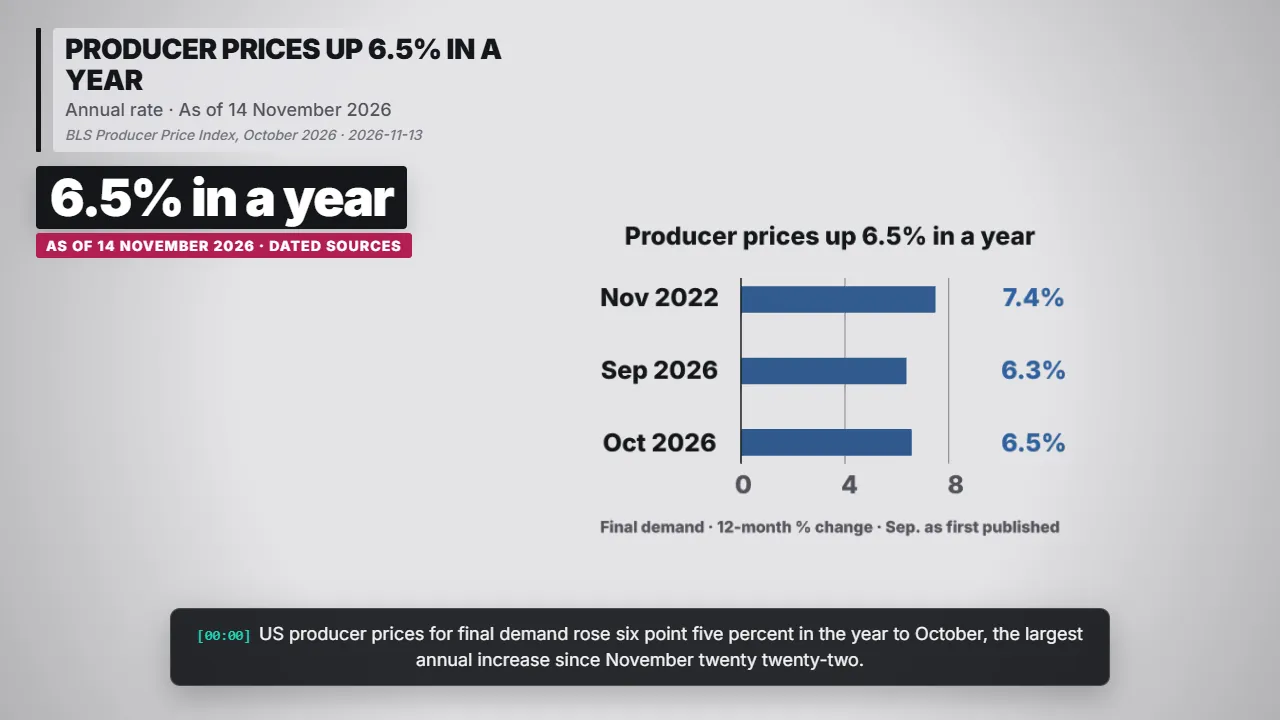
Bar chart: Producer prices up 6.5% in a year. US producer prices for final demand rose six point five percent in the year to October, the largest annual increase since November twenty twenty-two.
Producer prices up 6.5% in a year BLS Producer Price Index, October 2026 · 2026-11-13

US producer prices for final demand rose six point five percent in the year to October, the largest annual increase since November twenty twenty-two.

BLS Producer Price Index, October 2026 · 2026-11-13

Monthly increase slows to 0.3%
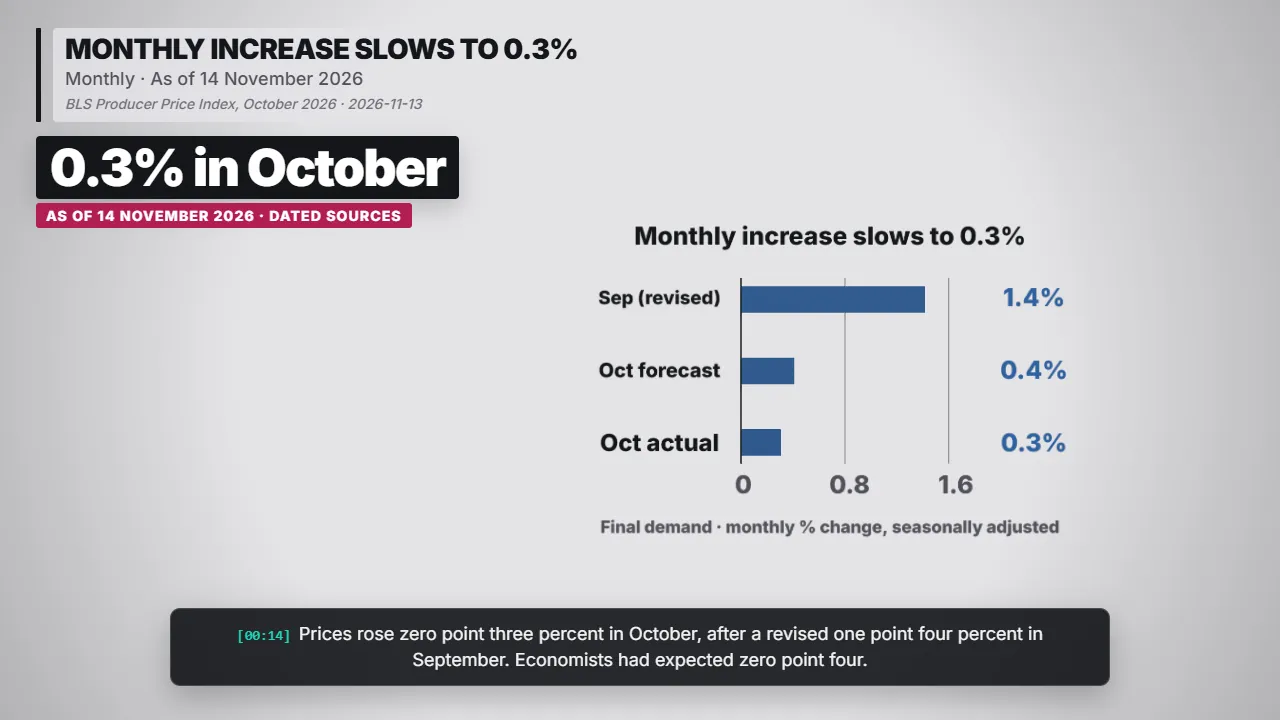
Bar chart: Monthly increase slows to 0.3% — 0.3% in October. Prices rose zero point three percent in October, after a revised one point four percent in September.
Monthly increase slows to 0.3% — 0.3% in October BLS Producer Price Index, October 2026 · 2026-11-13

Prices rose zero point three percent in October, after a revised one point four percent in September. Economists had expected zero point four.

BLS Producer Price Index, October 2026 · 2026-11-13

Goods drive October’s rise
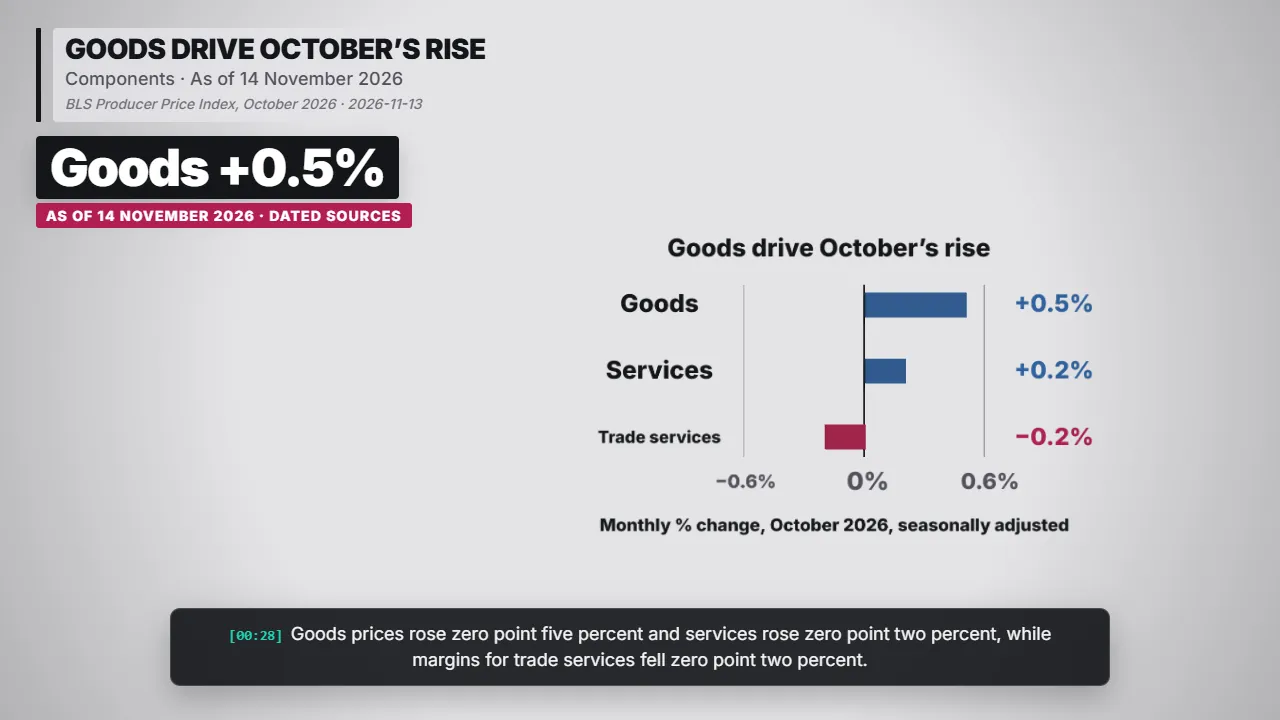
Change chart: Goods drive October’s rise — Goods +0.5%. Goods prices rose zero point five percent and services rose zero point two percent, while margins for trade services fell zero point two percent.
Goods drive October’s rise — Goods +0.5% BLS Producer Price Index, October 2026 · 2026-11-13

Goods prices rose zero point five percent and services rose zero point two percent, while margins for trade services fell zero point two percent.

BLS Producer Price Index, October 2026 · 2026-11-13

Core producer prices up 4.9% in a year
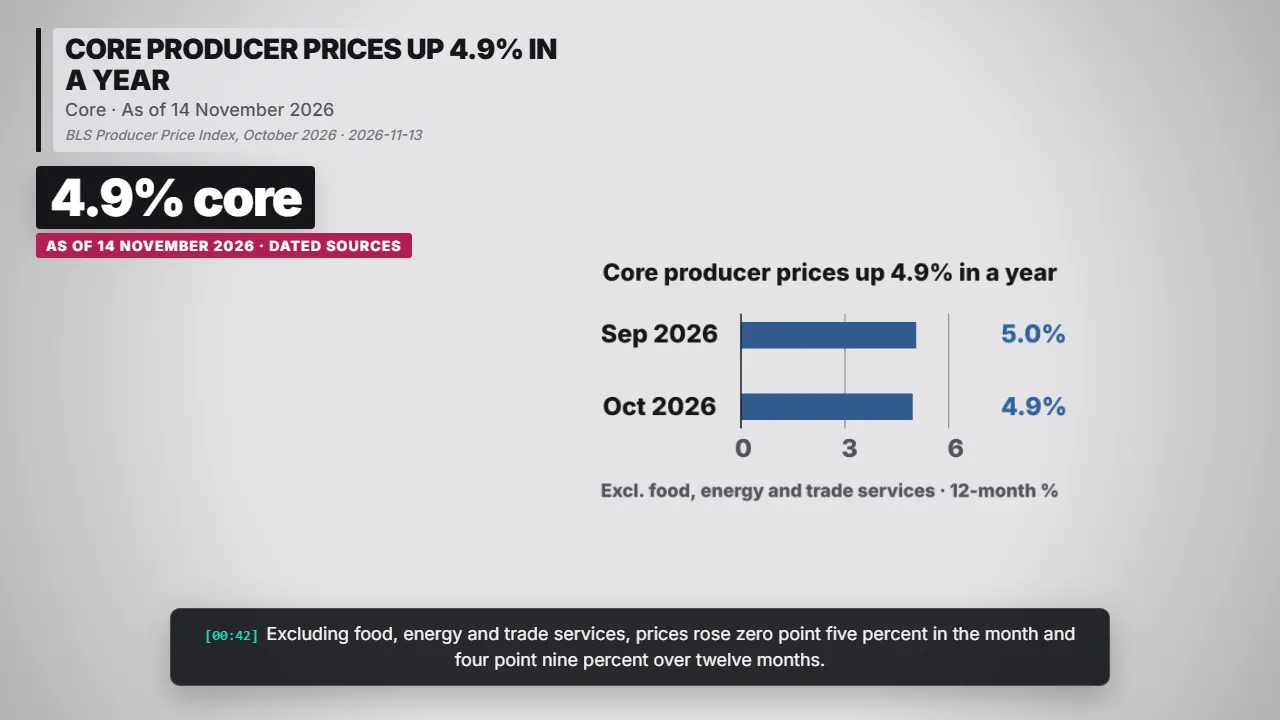
Bar chart: Core producer prices up 4.9% in a year — 4.9% core. Excluding food, energy and trade services, prices rose zero point five percent in the month and four point nine percent over twelve months.
Core producer prices up 4.9% in a year — 4.9% core BLS Producer Price Index, October 2026 · 2026-11-13

Excluding food, energy and trade services, prices rose zero point five percent in the month and four point nine percent over twelve months.

BLS Producer Price Index, October 2026 · 2026-11-13

A monthly slowdown, an annual high
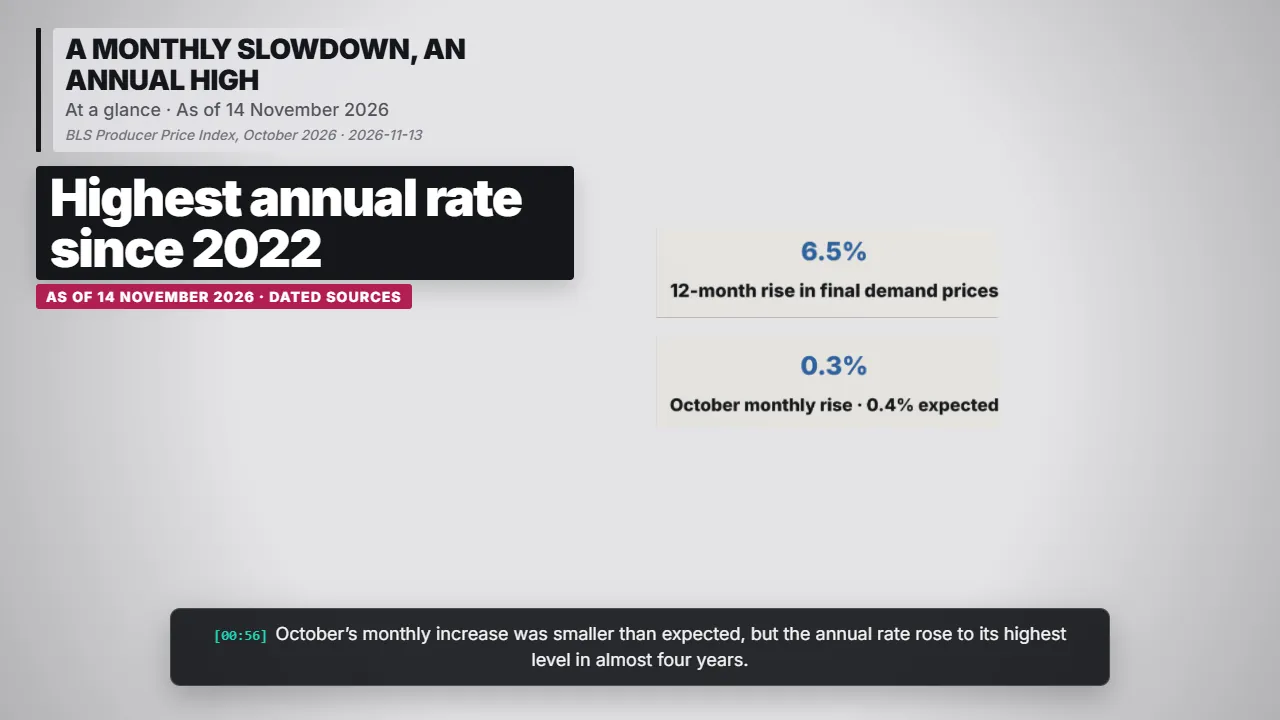
3D graphic: A monthly slowdown, an annual high — Highest annual rate since 2022. October’s monthly increase was smaller than expected, but the annual rate rose to its highest level in almost four years.
A monthly slowdown, an annual high — Highest annual rate since 2022 BLS Producer Price Index, October 2026 · 2026-11-13

October’s monthly increase was smaller than expected, but the annual rate rose to its highest level in almost four years.

BLS Producer Price Index, October 2026 · 2026-11-13

SOURCES AND NOTES

The figures come from the Bureau of Labor Statistics releases for October and September. News agencies reported the economists’ forecast.

BLS Producer Price Index, October 2026 · 2026-11-13

Source links

All Explainers
[00:00]
Read the full article

US producer prices rise 0.3% in October and 6.5% from a year earlier

As of 14 November 2026. Figures are seasonally adjusted monthly changes and unadjusted 12-month changes from the Bureau of Labor Statistics release of 13 November 2026. The September 12-month rate is shown as first published; September’s monthly change was revised to 1.4%. The 0.4% forecast is the economists’ consensus reported by news agencies.

BLS Producer Price Index, October 2026. 2026-11-13. Monthly and 12-month changes for final demand, goods, services, trade services and the core index.

BLS Producer Price Index, September 2026. 2026-10-15. First-published September 12-month rates for final demand and the core index.

Stock Titan. 2026-11-13. Reports the 0.4% Dow Jones consensus and the 6.5% annual rise.